
Data Governance of First-Party Data of Advertisers
2021|Type: Platform Product|Tag: Design for Efficiency|Role: UX Design
Background
In the digital advertising market, the revenue scale of an ad network is determined by two factors - poor flow and monetization efficiency. Ad networks are currently prioritizing high-quality data ingestion and increased efficiency in data application to optimize their efficiency. This has become a consensus in many industries as well as on the platform side.
Currently, AMS data can be categorized into first-party and second-party data. Since the second half of 2020, the demand for ROI on the advertisers' side, as well as the demand for data volume on the platform side, has increased to improve the efficiency of the ad network. In many industries, the ingestion and application of first-party data are increasingly highlighted and put in a crucial position when planning how to achieve the industry's revenue goals.
In the 'Beyond the Design: Feature' article, we know that for data, we have many opportunities to further improve the efficiency and effectiveness of R&D. One of them is data governance.
Research
Performance-based advertising has become increasingly popular across many industries. As a result, businesses have recognized the importance of using first-party data to optimize and enhance the effectiveness of ad delivery.
However, due to the vast differences in industries and conversion paths, the Action Type accumulated in the past was unable to accurately encompass the behavioral data of each conversion path. To address this issue, platforms collaborate closely with advertisers through industry operations. Advertisers provide their detailed user behavior data, which includes basic fields such as User ID, Action Type, Action Time, Channel, Action Parameter, and other essential information. The platform then uses this advertiser data, combined with Tencent's second-party data and algorithms, to provide advertisers with custom services like scoring, reranking, and bid optimization. This deep optimization approach helps businesses achieve their goals and improve ROI.
Despite the benefits of using first-party data, there are still many challenges in the pipeline. Therefore, we have identified the pain points of the first-party data at various stages from the perspective of the different roles involved
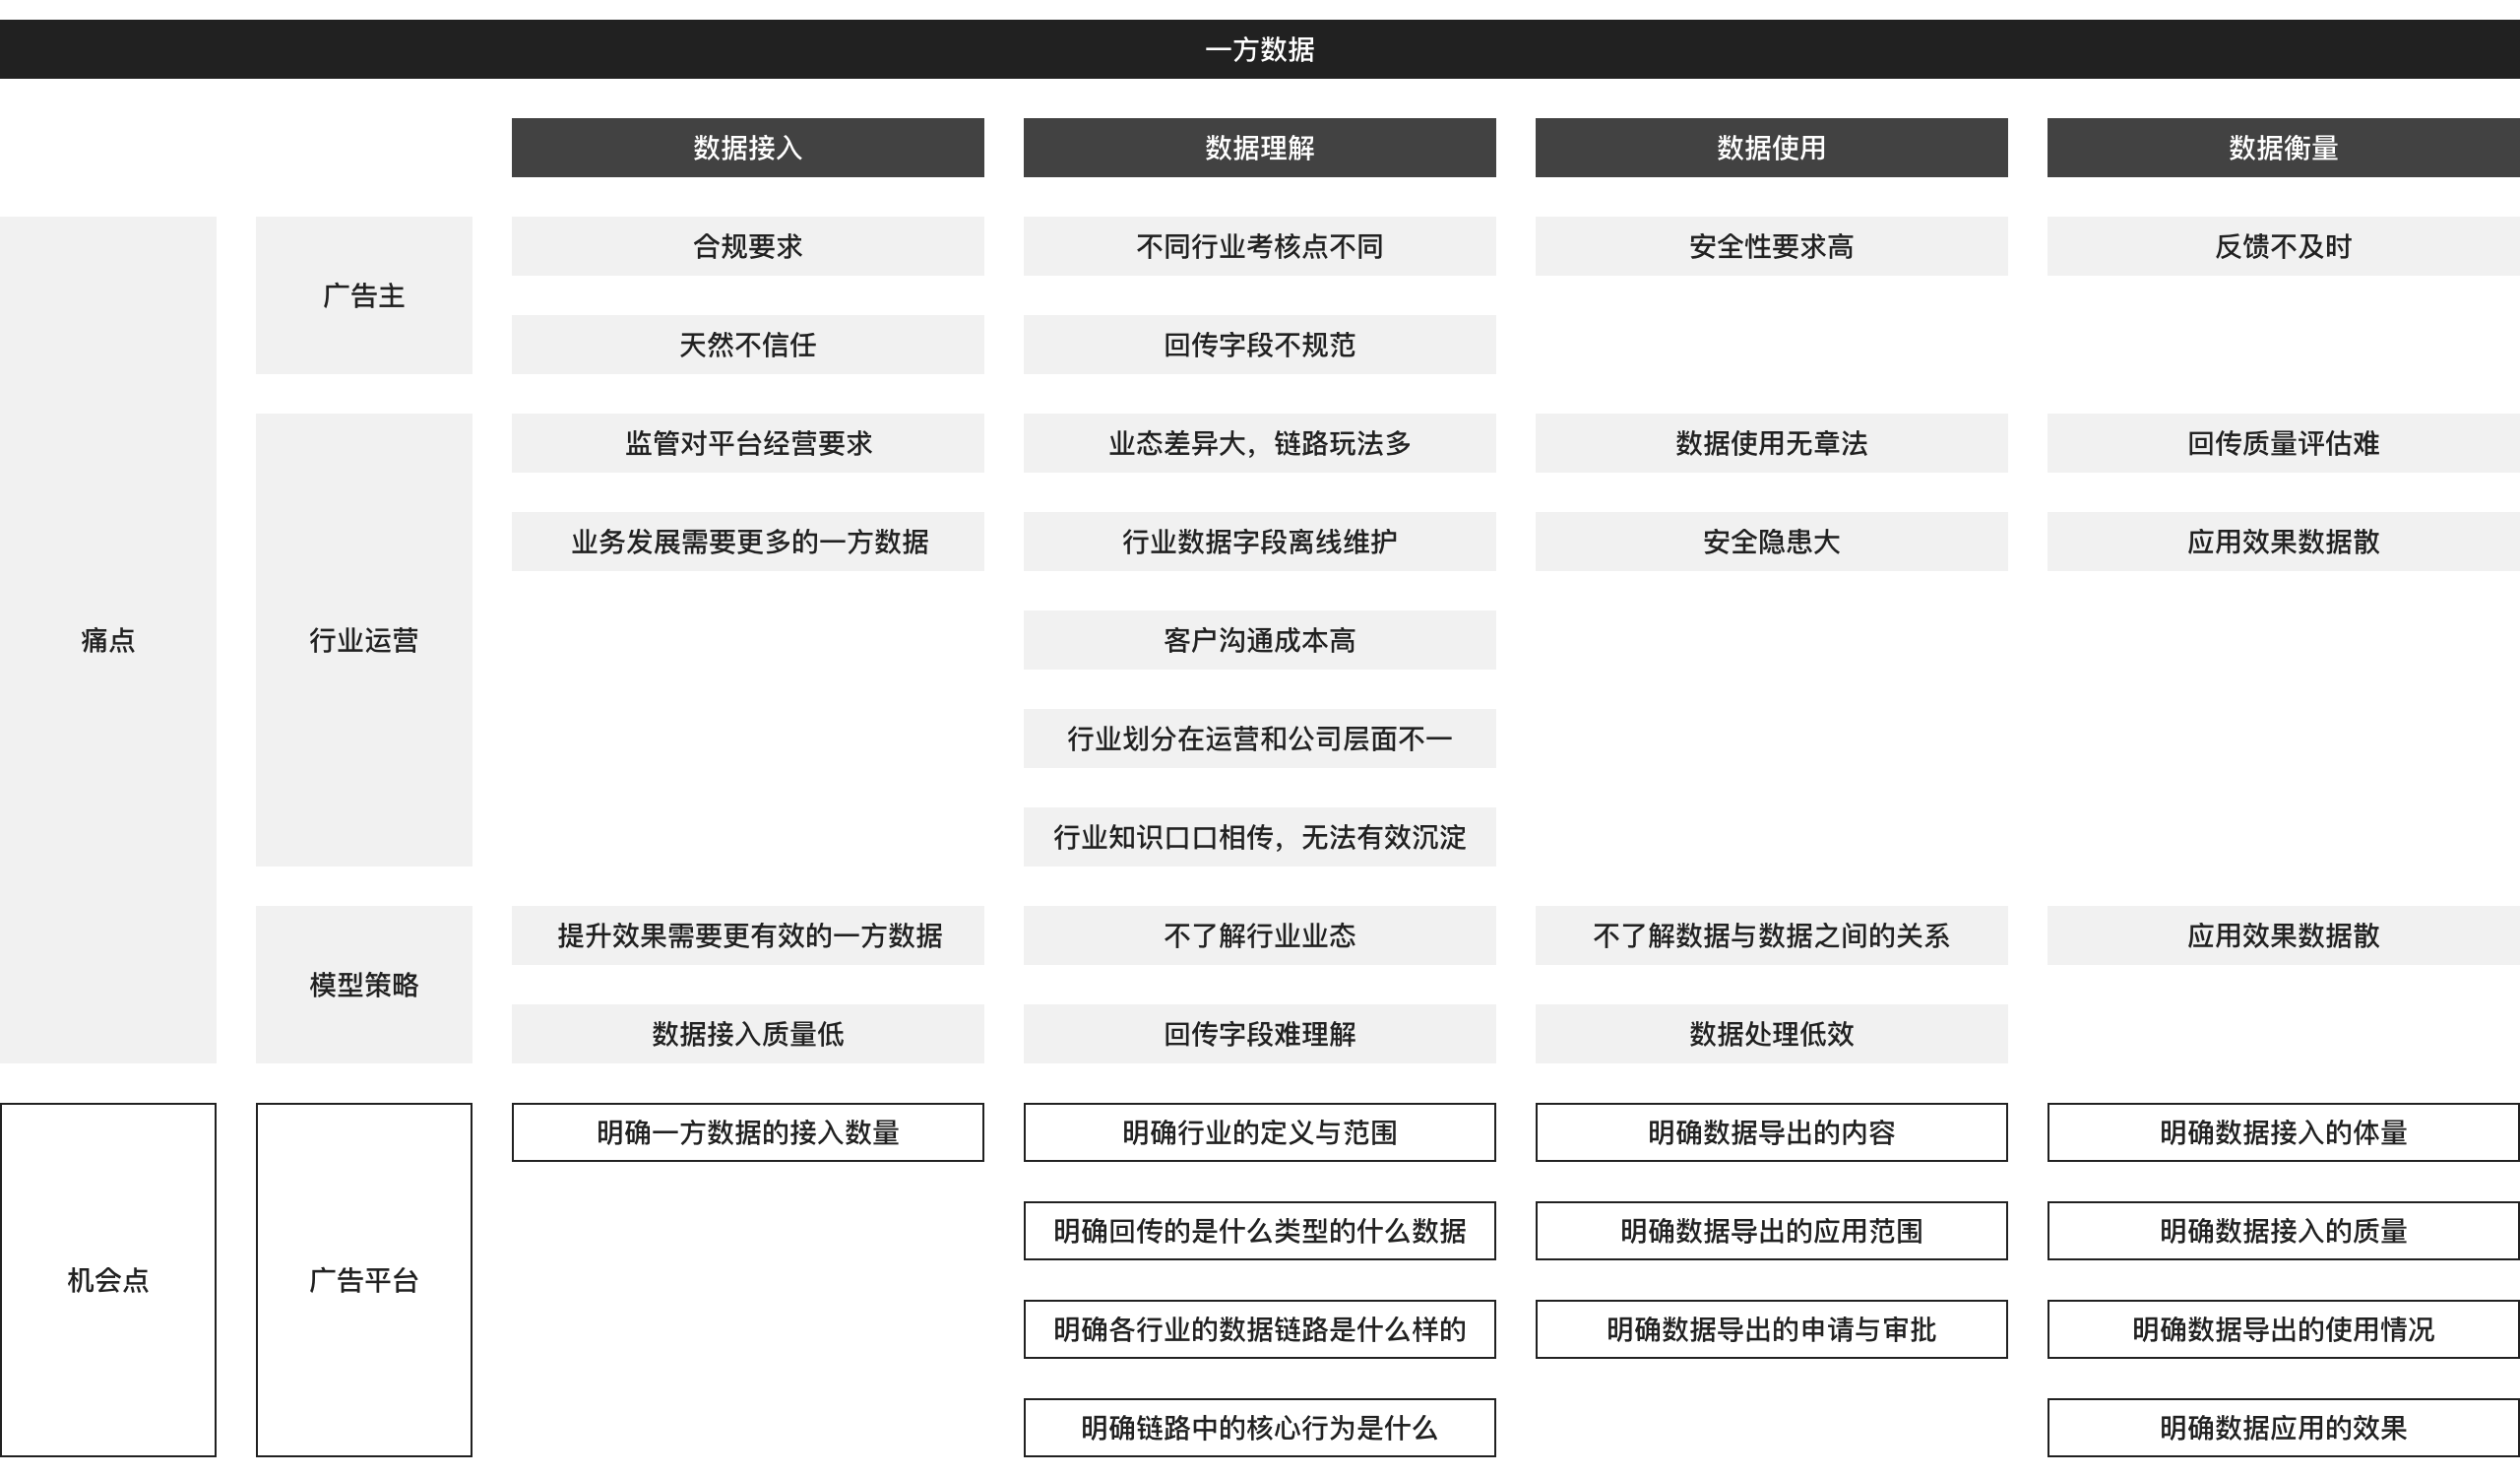
Pain Points in Every Phase
By automating communication tasks, the first-party data governance process gains a point of opportunity.
Solution
Value Proposition
Our team provides end-to-end solutions for industry operations, starting from data ingestion to data application. Our aim is to deliver a better measurement of first-party data, enabling better understanding, control, and application, and helping our clients build an industry playbook to enhance their business experience.
Objective
- Efficiency in the life cycle increases. The data governance process was shortened from one month to one week.
- Volume increases in every industry. Drive industry operations to access core data.
How might we design Information Architecture?
Problem
Currently, the DataCube platform has integrated first-party data governance, metadata management, ad features, and user features into its product system. The platform's unique information architecture distinguishes itself by making first-party data governance more sensitive, visible, and editable only to industry members. However, there are no scope limitations for the other modules.
Design Analysis
Data understanding, answering the question ‘Who is it?’
- The different types of return fields, including Customized Action Types (i.e. fields outside of the Standard Action Types on the developer's document), Action Parameters, and Action Attributes, along with what data is returned.
The Industry Conversion Path consists of Customized Action Types and Standard Action Types, and the industry playbook.
The Data Ingestion Volume Target for the Conversion Path, along with the core actions of the industry.
Data overview, answering the question ‘How many are they?’
- What are the sources of data? How much data is being ingested? How much of that is core action data for the conversion path? How are the targets achieved? - What is the current state of data ingestion?
Data quality, answering the question ‘Is it good?’
- Fundamental analysis - how good is the data itself?
- Comprehensive analysis - how good is the data in the industry?
Data ETL, answering the question "Does it work?"
- Create ETL tasks to specify - how and where data is used
- Export library tables with relevant fields - who the data is for, what fields are used
- Measure the application's impact on data - to what degree does the data work after it has been applied
Information Architecture
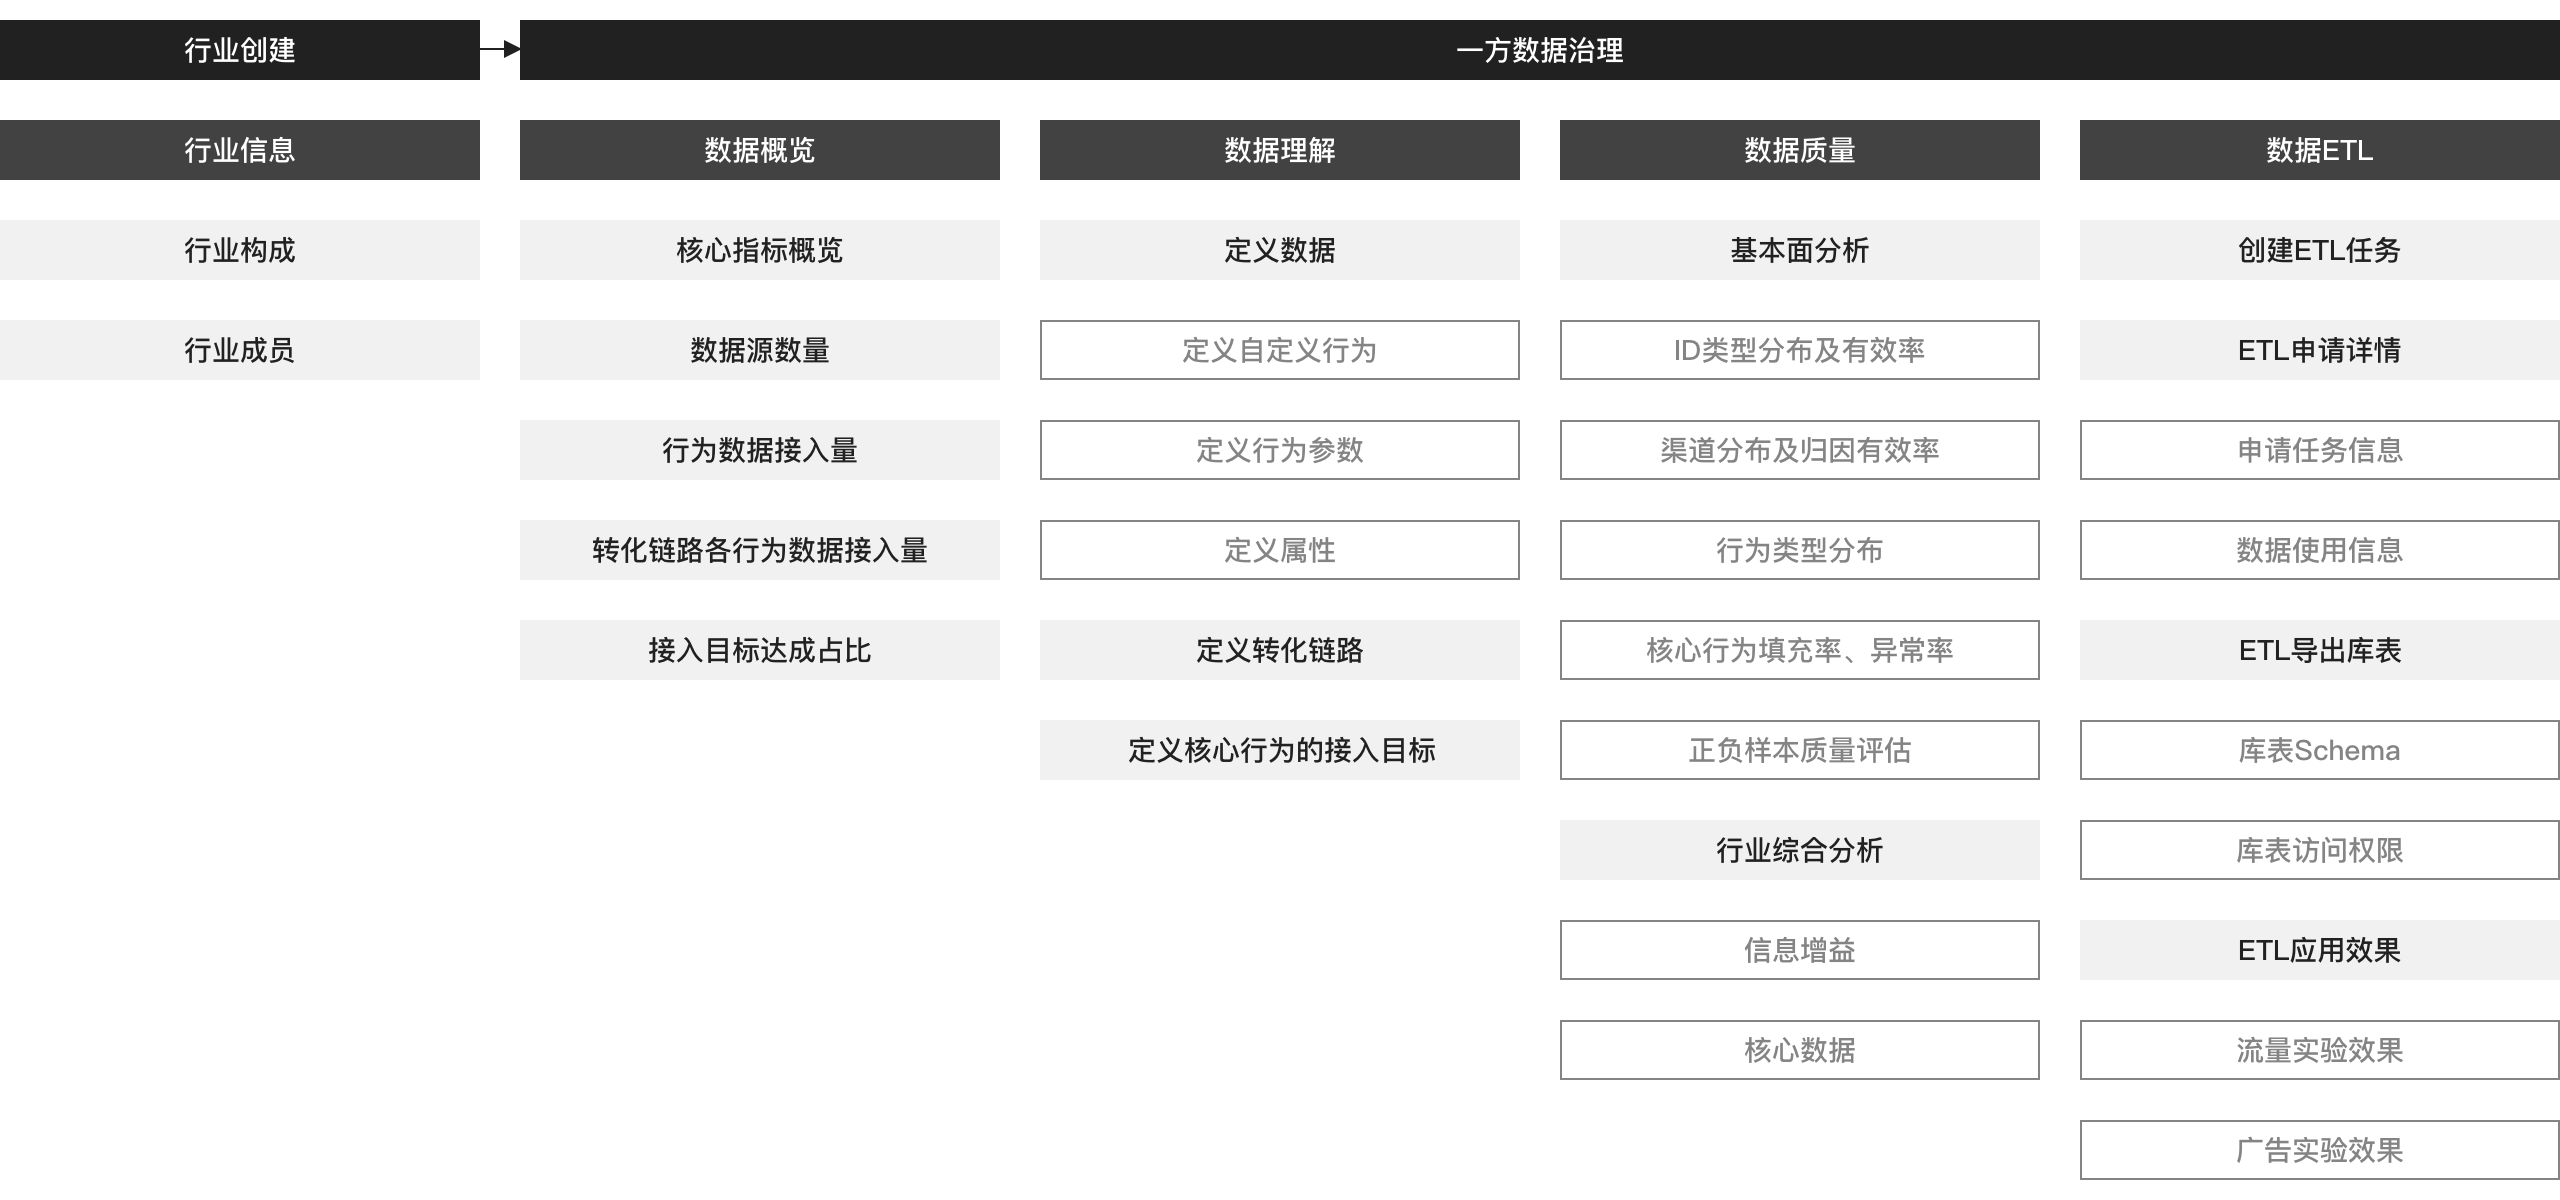
Information Architecture
Based on the information architecture presented above, the first step is to create an industry-specific framework. The subsequent step is to comprehend the data, which is crucial. Based on the data comprehension, advertisers can initiate the process of data acquisition. Members of the industry can then have an overview of the data and proceed to create data ETL tasks. Finally, data quality is ensured. In essence, the entire solution can be distilled to a design focus.
Industry Creation focuses on roles and permissions.
Data Understanding focuses on the user flow of creation.
Data Overview focuses on data visualization.
Data ETL focuses on the user flow of creation.
Data Quality focuses on data visualization.
How might we design the roles and permissions?
Problem
When it comes to handling first-party data in the DataCube platform, special consideration must be given to its high level of security. This includes determining who can access the data.
Design Objective
- Satisfy that the data is visible on an industry-wide basis.
Satisfy data is controllable among certain members.
Satisfy the extensibility of unknown requirements.
Design Strategy
The RBAC (Role-Based Access Control) model, which separates permissions by role, is a good choice. Under a specific industry:
- Firstly, it is possible to distinguish whether a user has permission to access the industry or not. By default, users without permission are restricted from accessing the industry.
Secondly, the highest authority is considered when granting access. Once a user applies for a new industry and is approved, they gain full read and write access to the functions and user configuration. In other words, the creator of the industry is granted the highest authority.
Thirdly, permission inheritance is also possible. If the user configuration authority is sufficiently flexible, there may be no difference between the user and the creator. Administrators can inherit other permissions, in addition to configuring user permissions for constraints.
Last but not least, for security reasons, not all users need to have read and write access to all product features. Therefore, read-only permissions can be set for viewers. If a viewer needs more access, the settings can be customized accordingly.
Solution
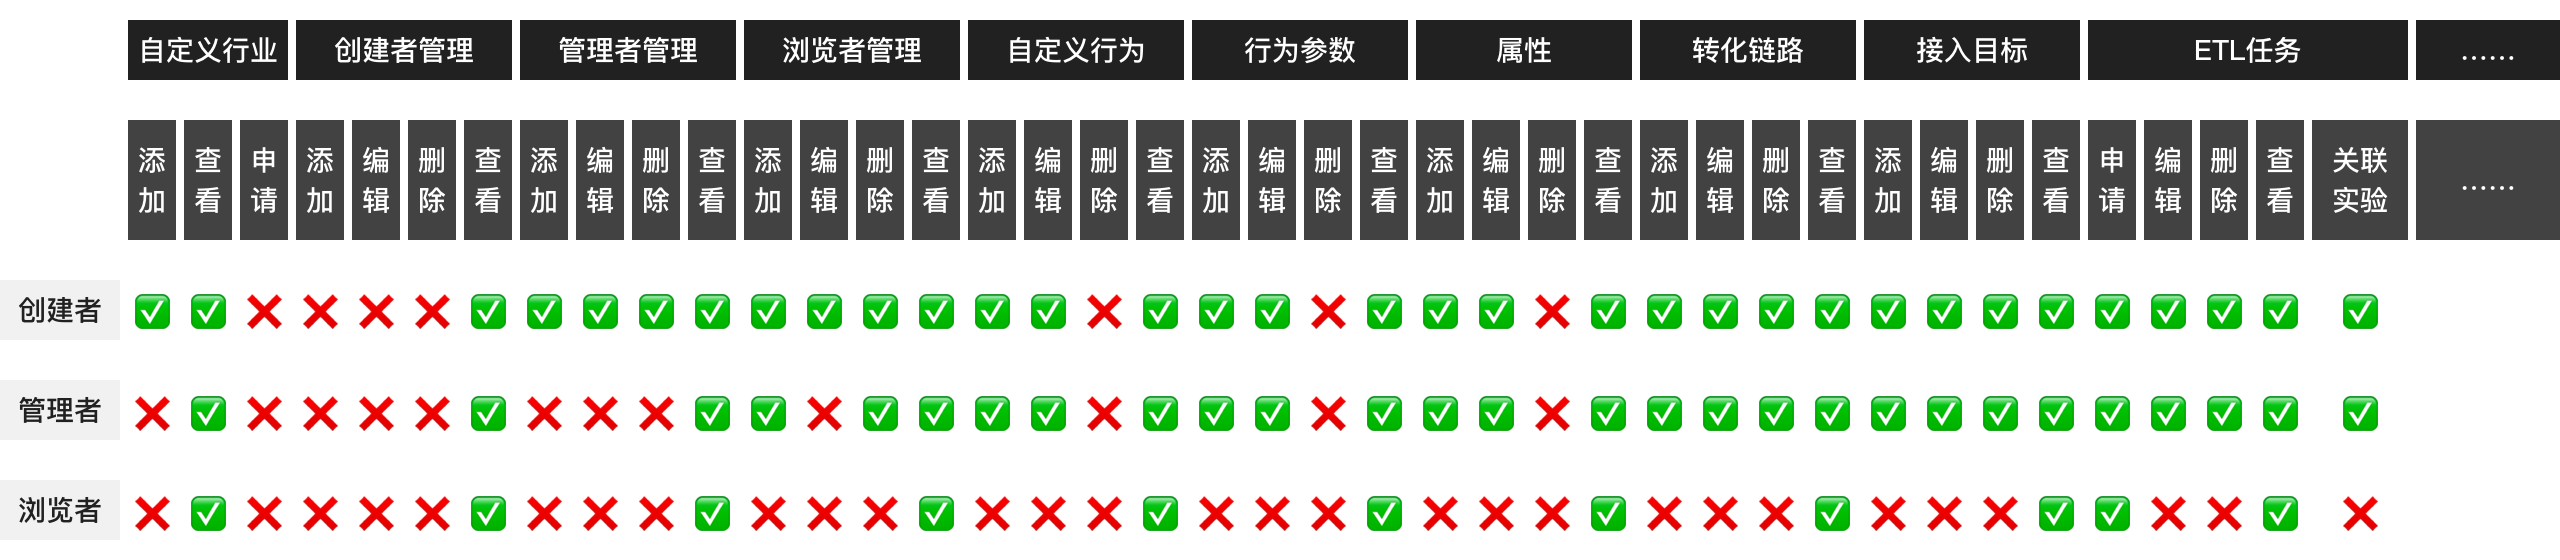
Permissions for Different Roles
How might we design the user flow of submitting a form?
Problem
Based on the information architecture, the user flow for creating involves two main aspects - data understanding and data ETL. Data understanding is a significant part of this process and requires a detailed session in a form. It involves creating Customized Action Types, Action Parameters, Action Attributes, and Conversion Paths, and determining the data ingestion volume targets. The number of fields that need to be filled for each task varies. Additionally, conversion paths and data ingestion volume targets are inherited from the process of creating Customized Action Types, Action Parameters, and Action Attributes. The data ingestion volume targets have dependencies among them, which makes it more complex. To summarize, the issues we faced during this process can be broken down into the following:
- Different types with different steps
Multiple dependencies meet sequential requirements
Design Objective
- Clear user flows should be defined for each task with a low entry barrier.
Design Strategy
- First-time use. When a user is first created, describe the tasks that need to be completed, focusing on the sequences.
It is important to create distinct templates for various user experiences, such as pages, pop-ups, cards.
Solution
When using the system for the first time, the user is guided through creating Customized Action Types, Action Parameters, Action Attributes, Conversion Paths, and data ingestion volume targets in that order.
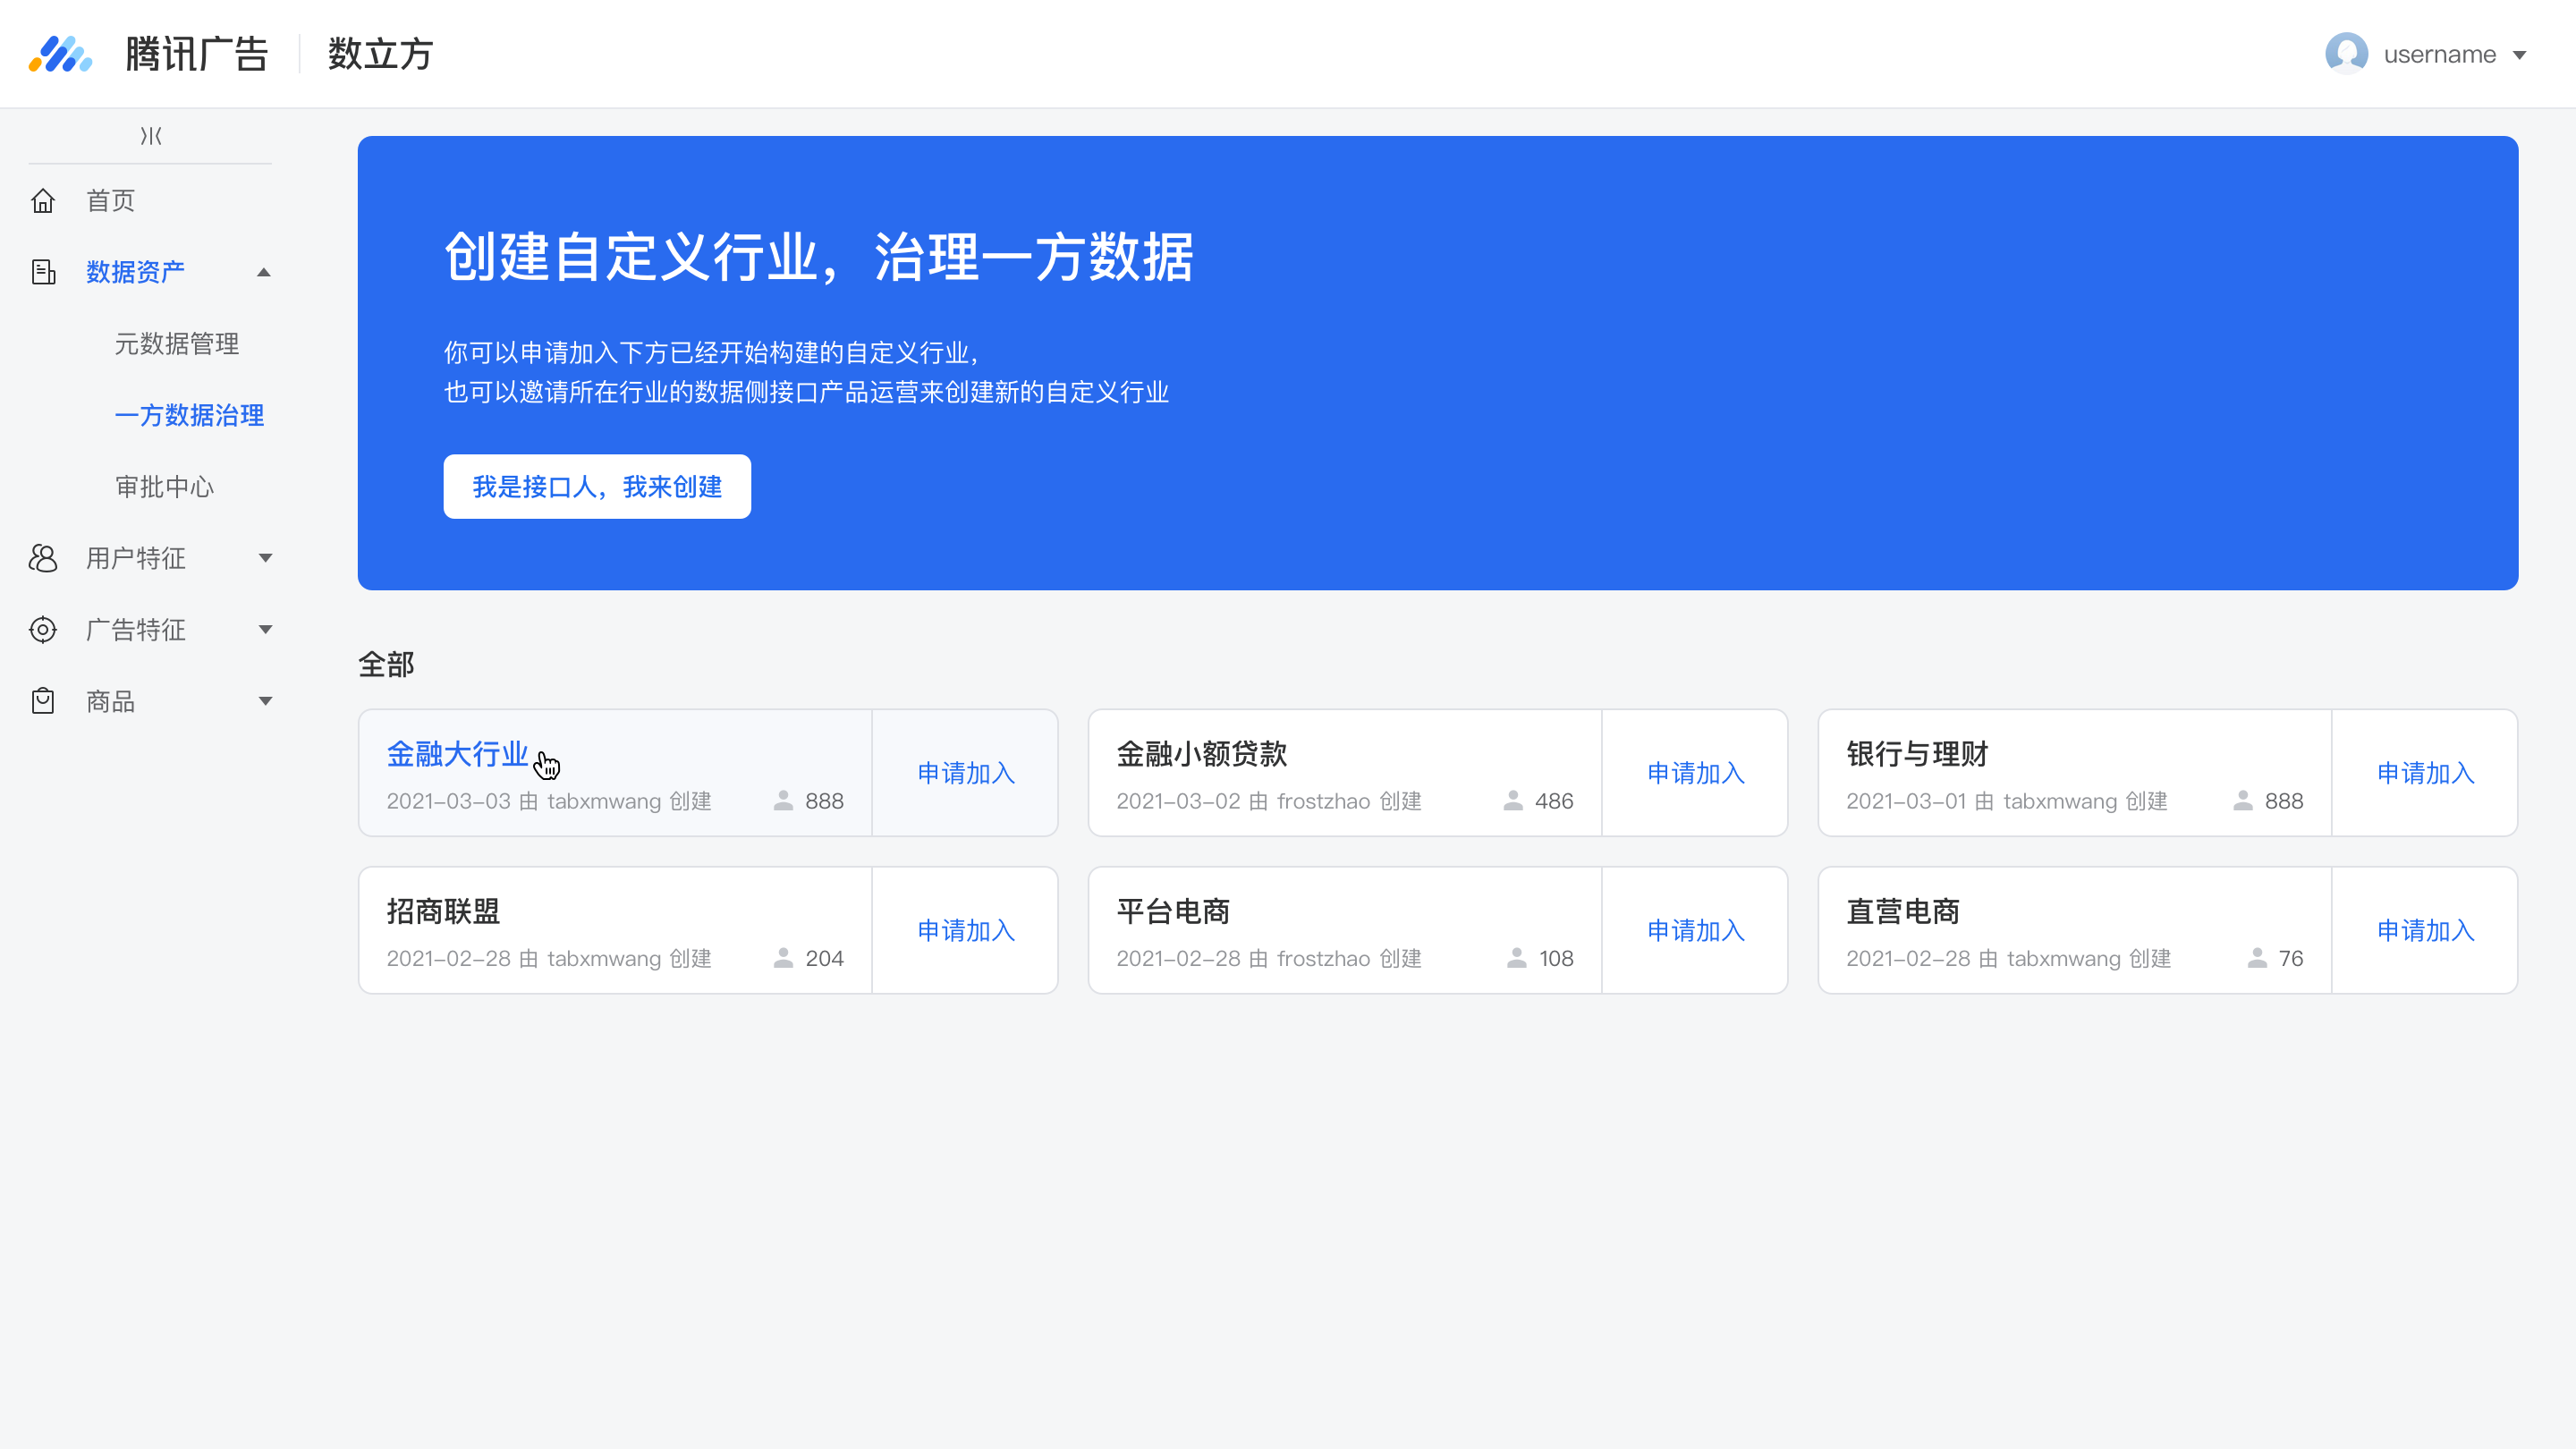
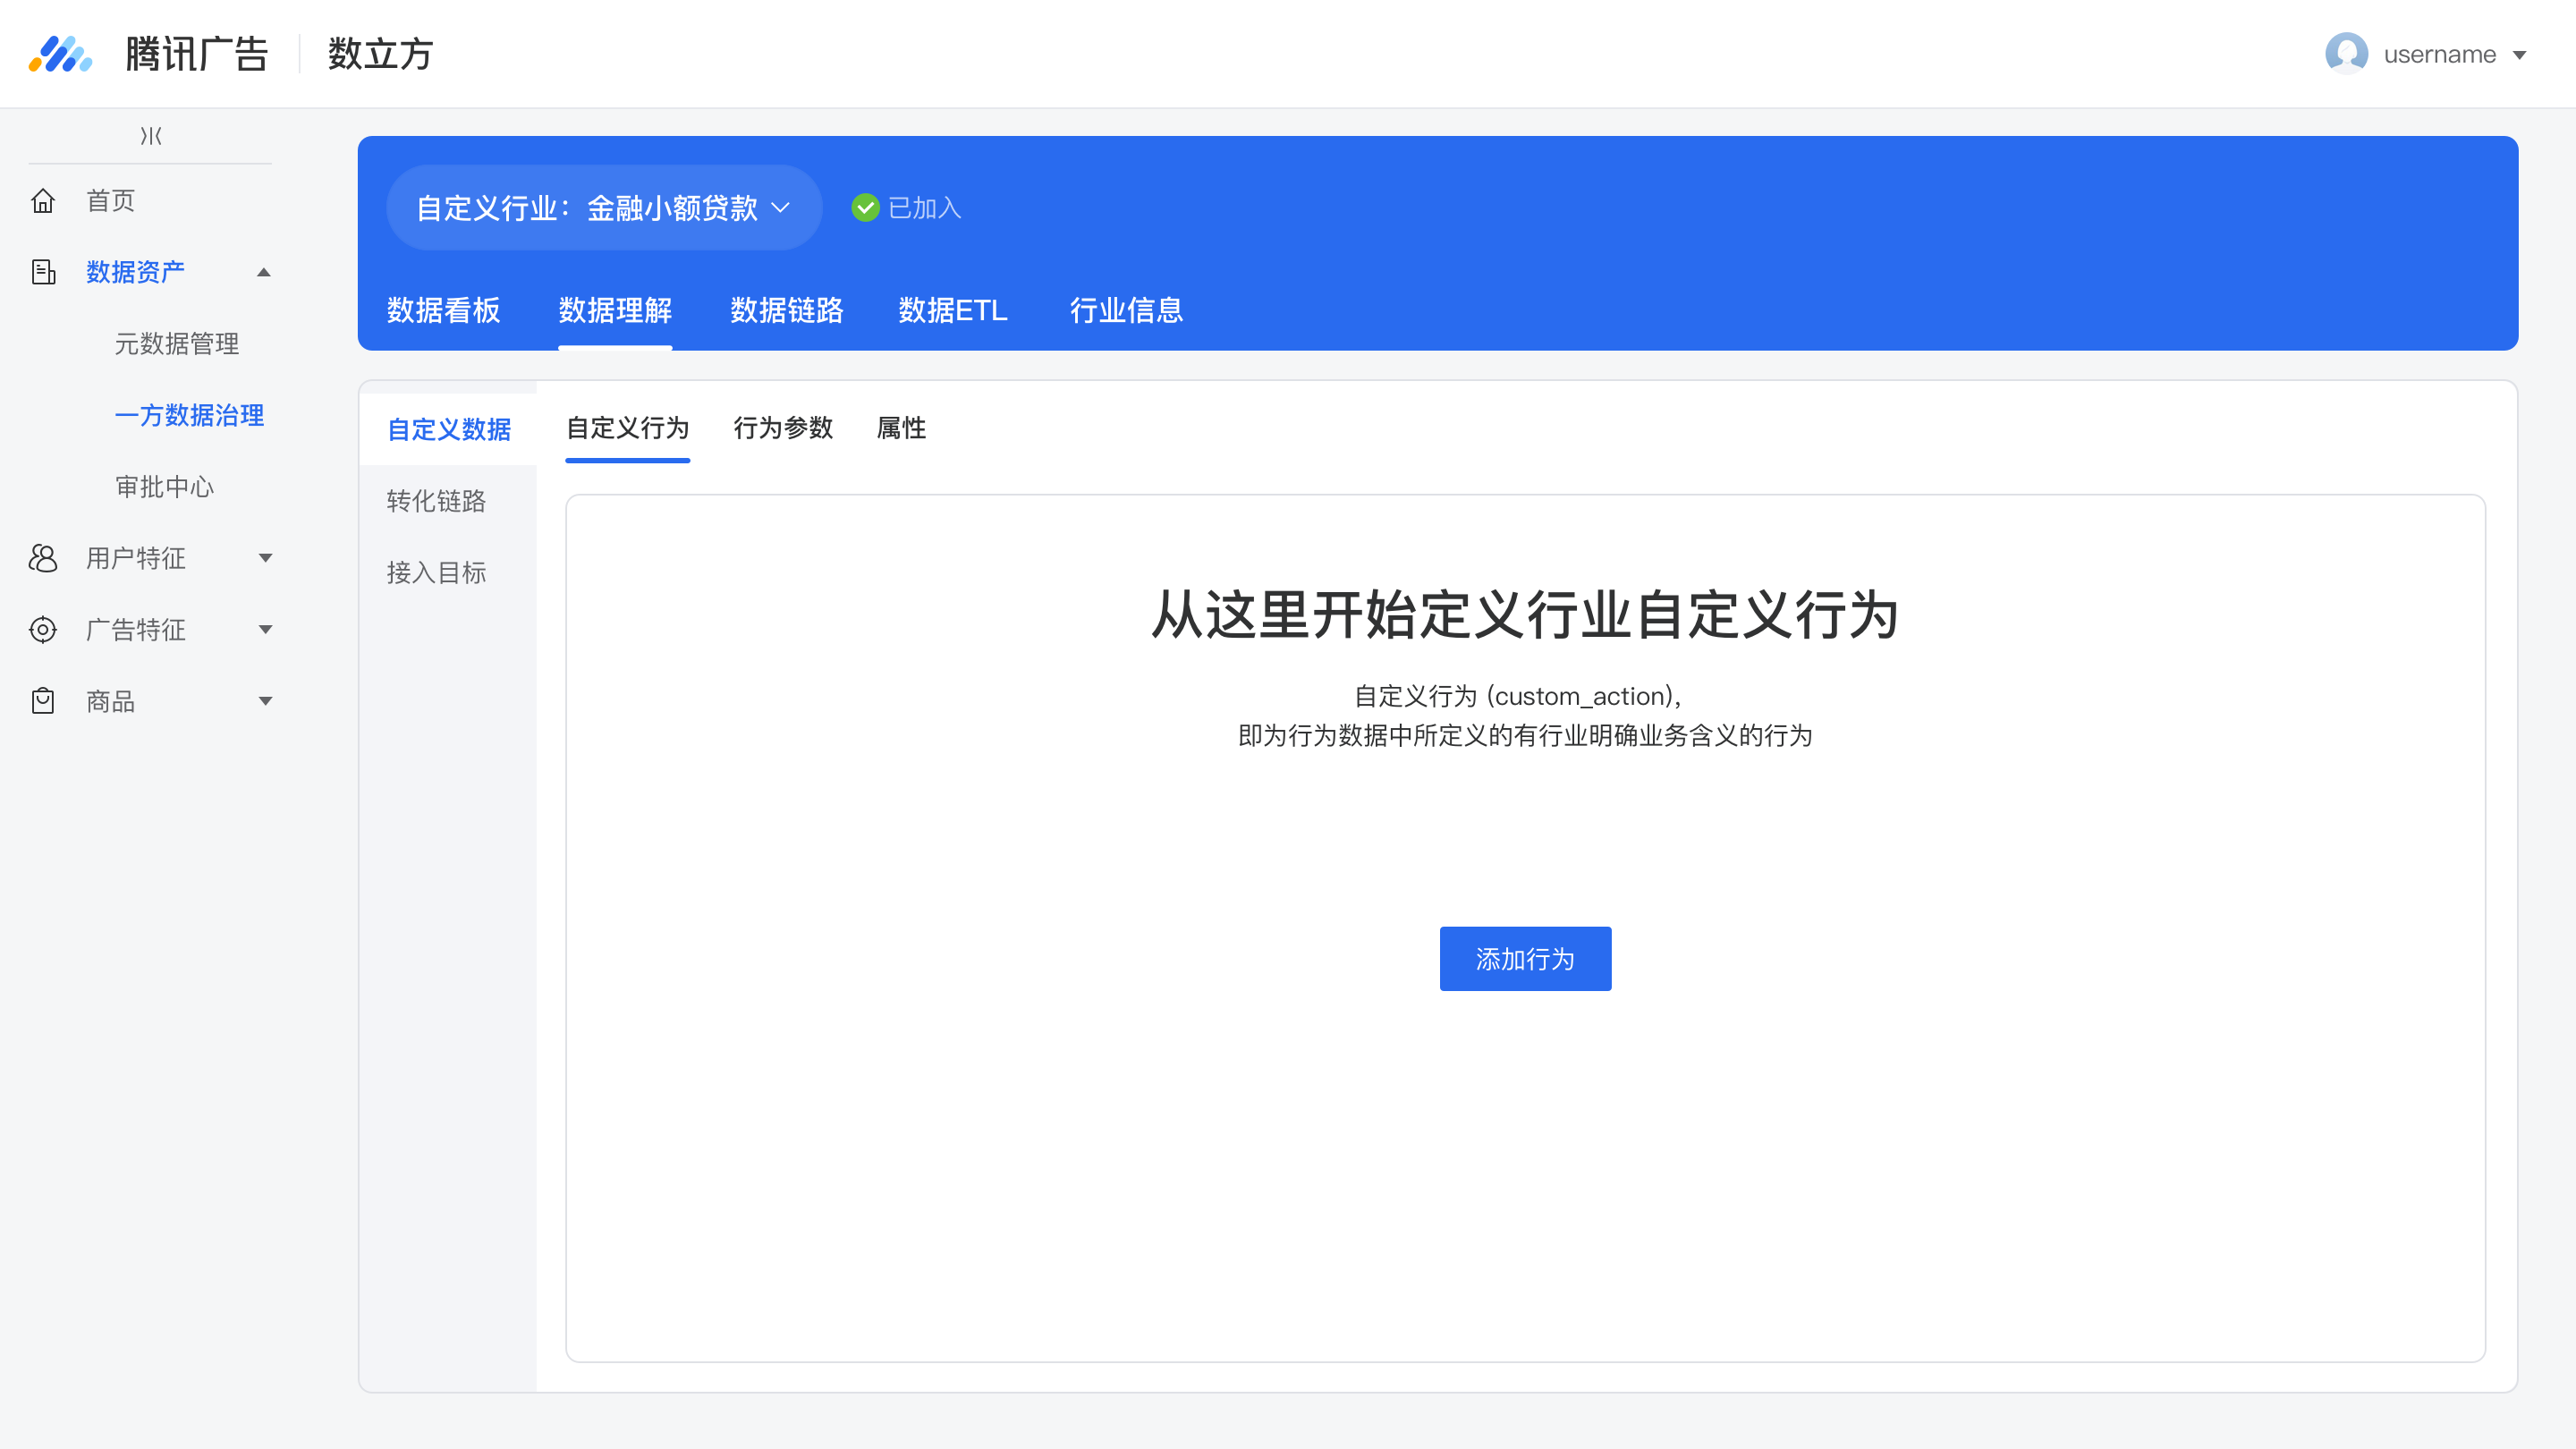
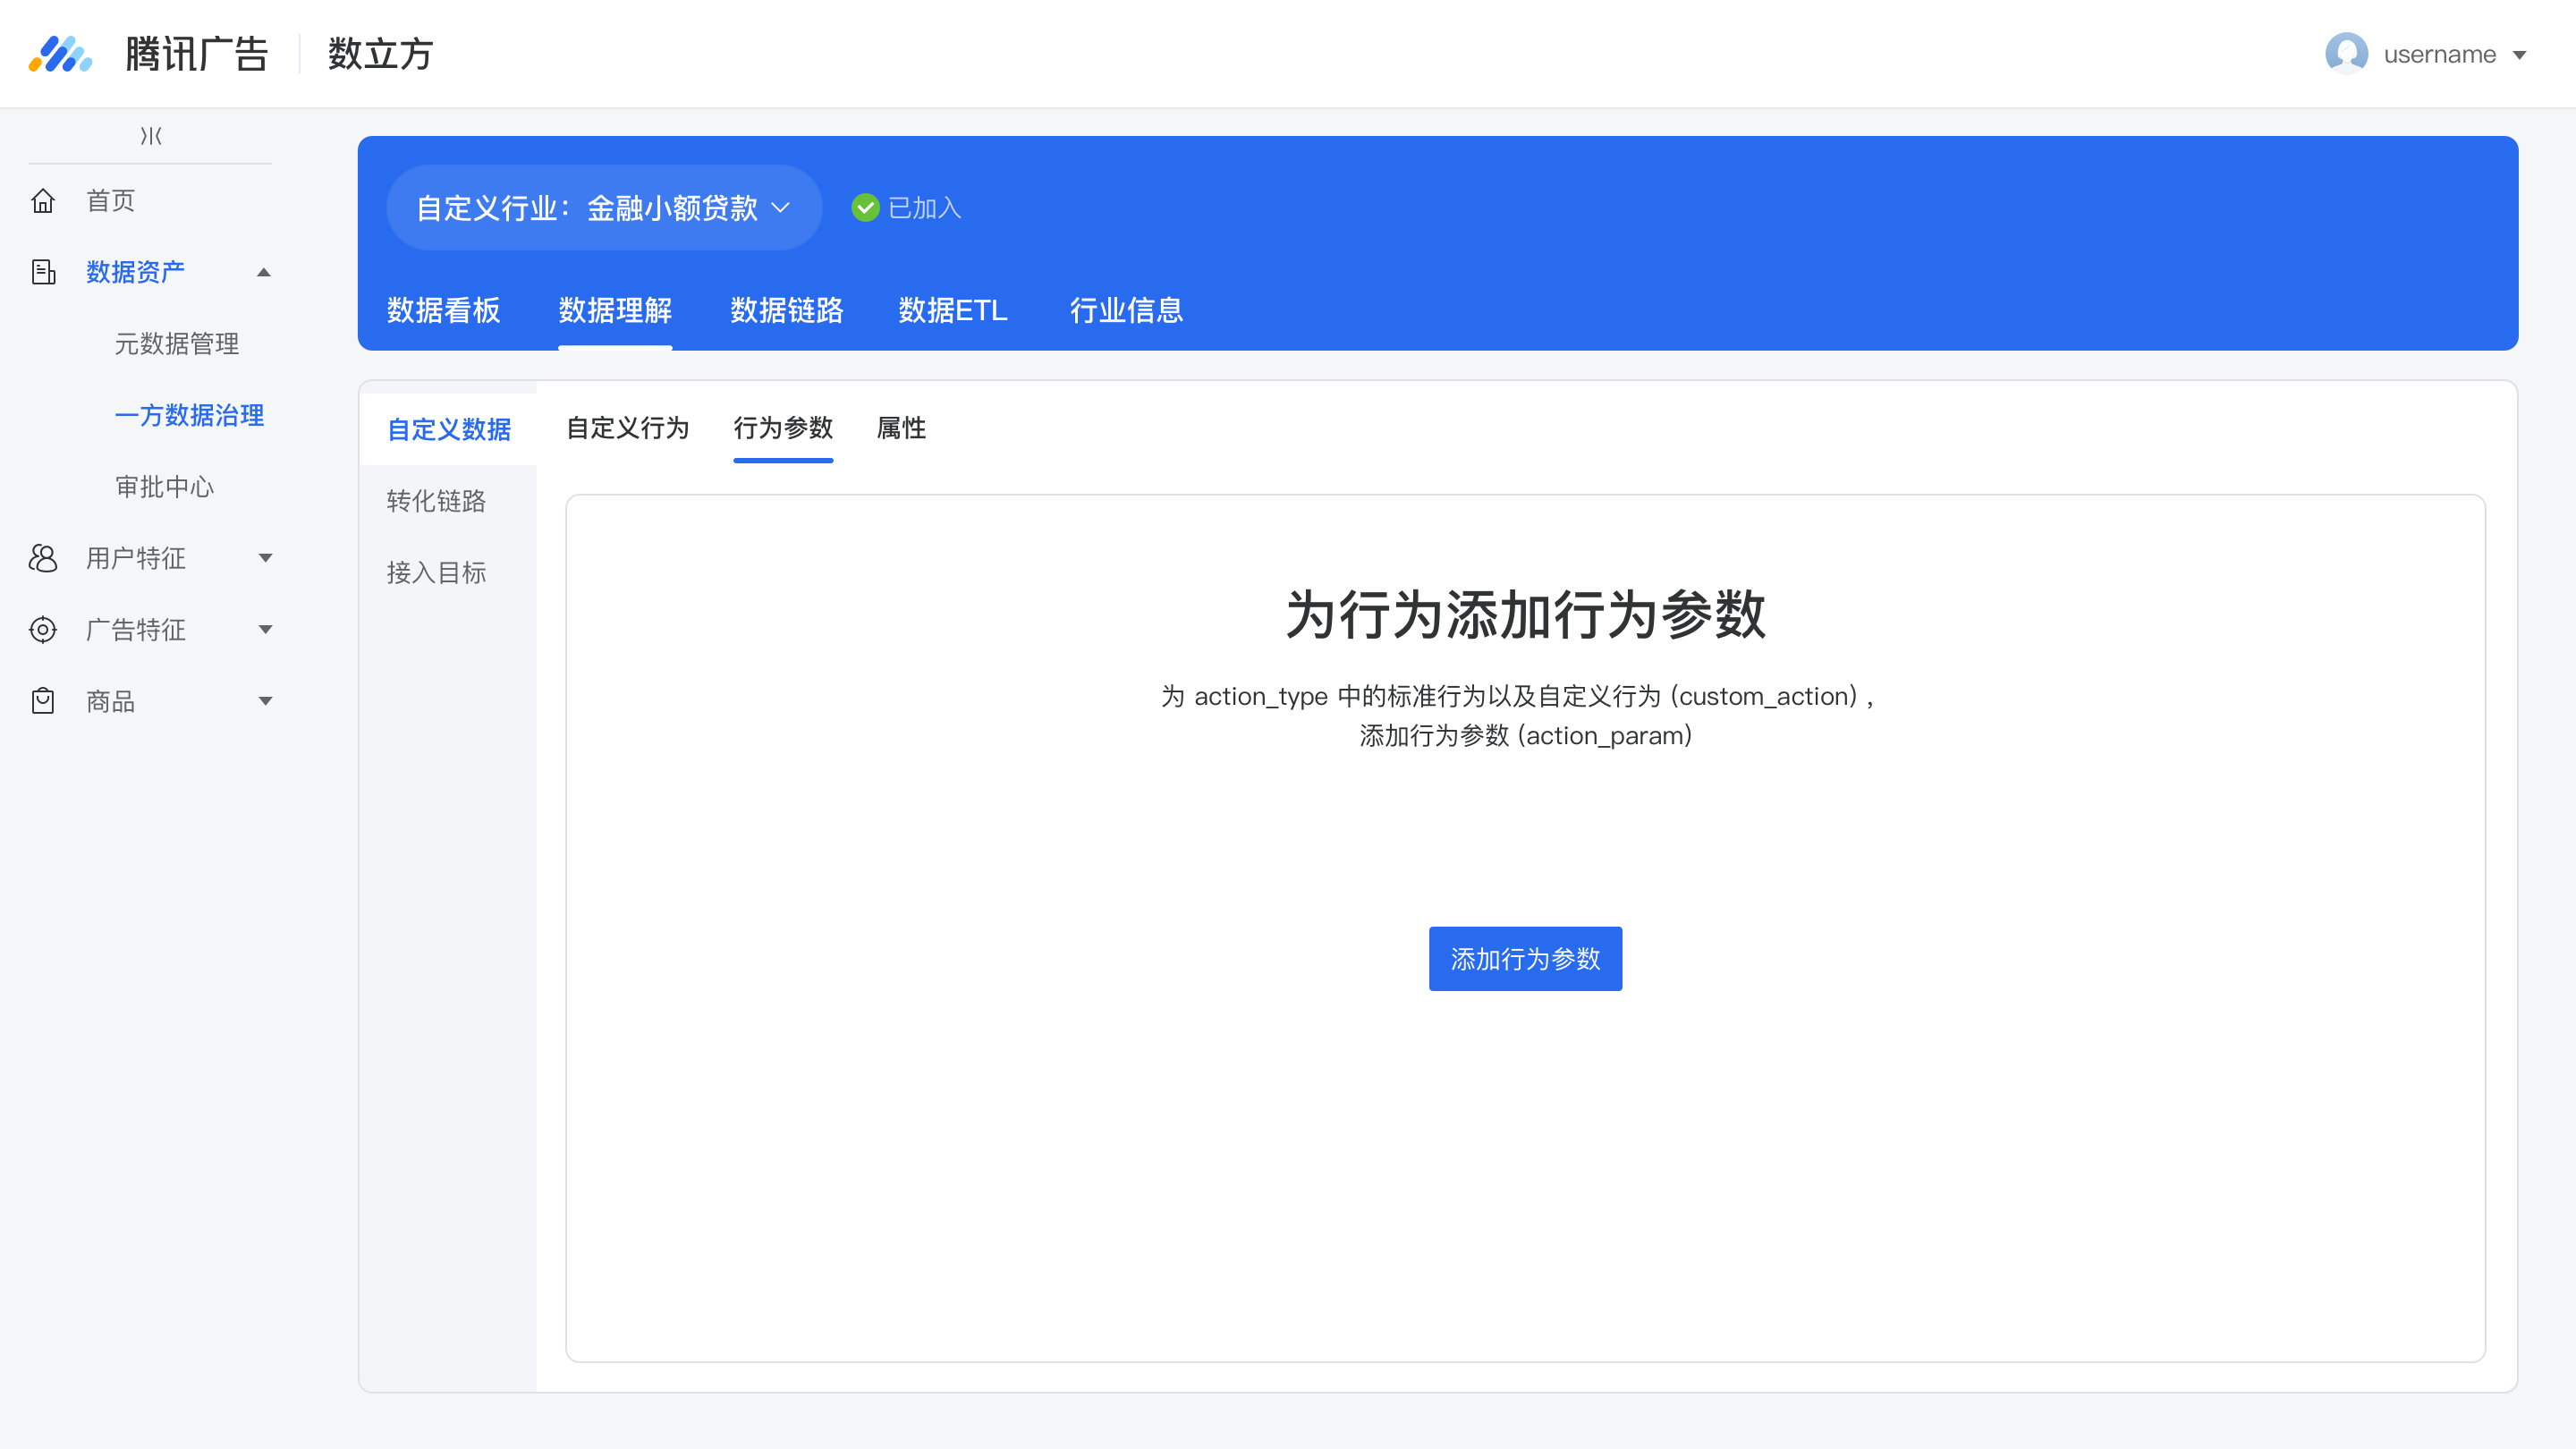
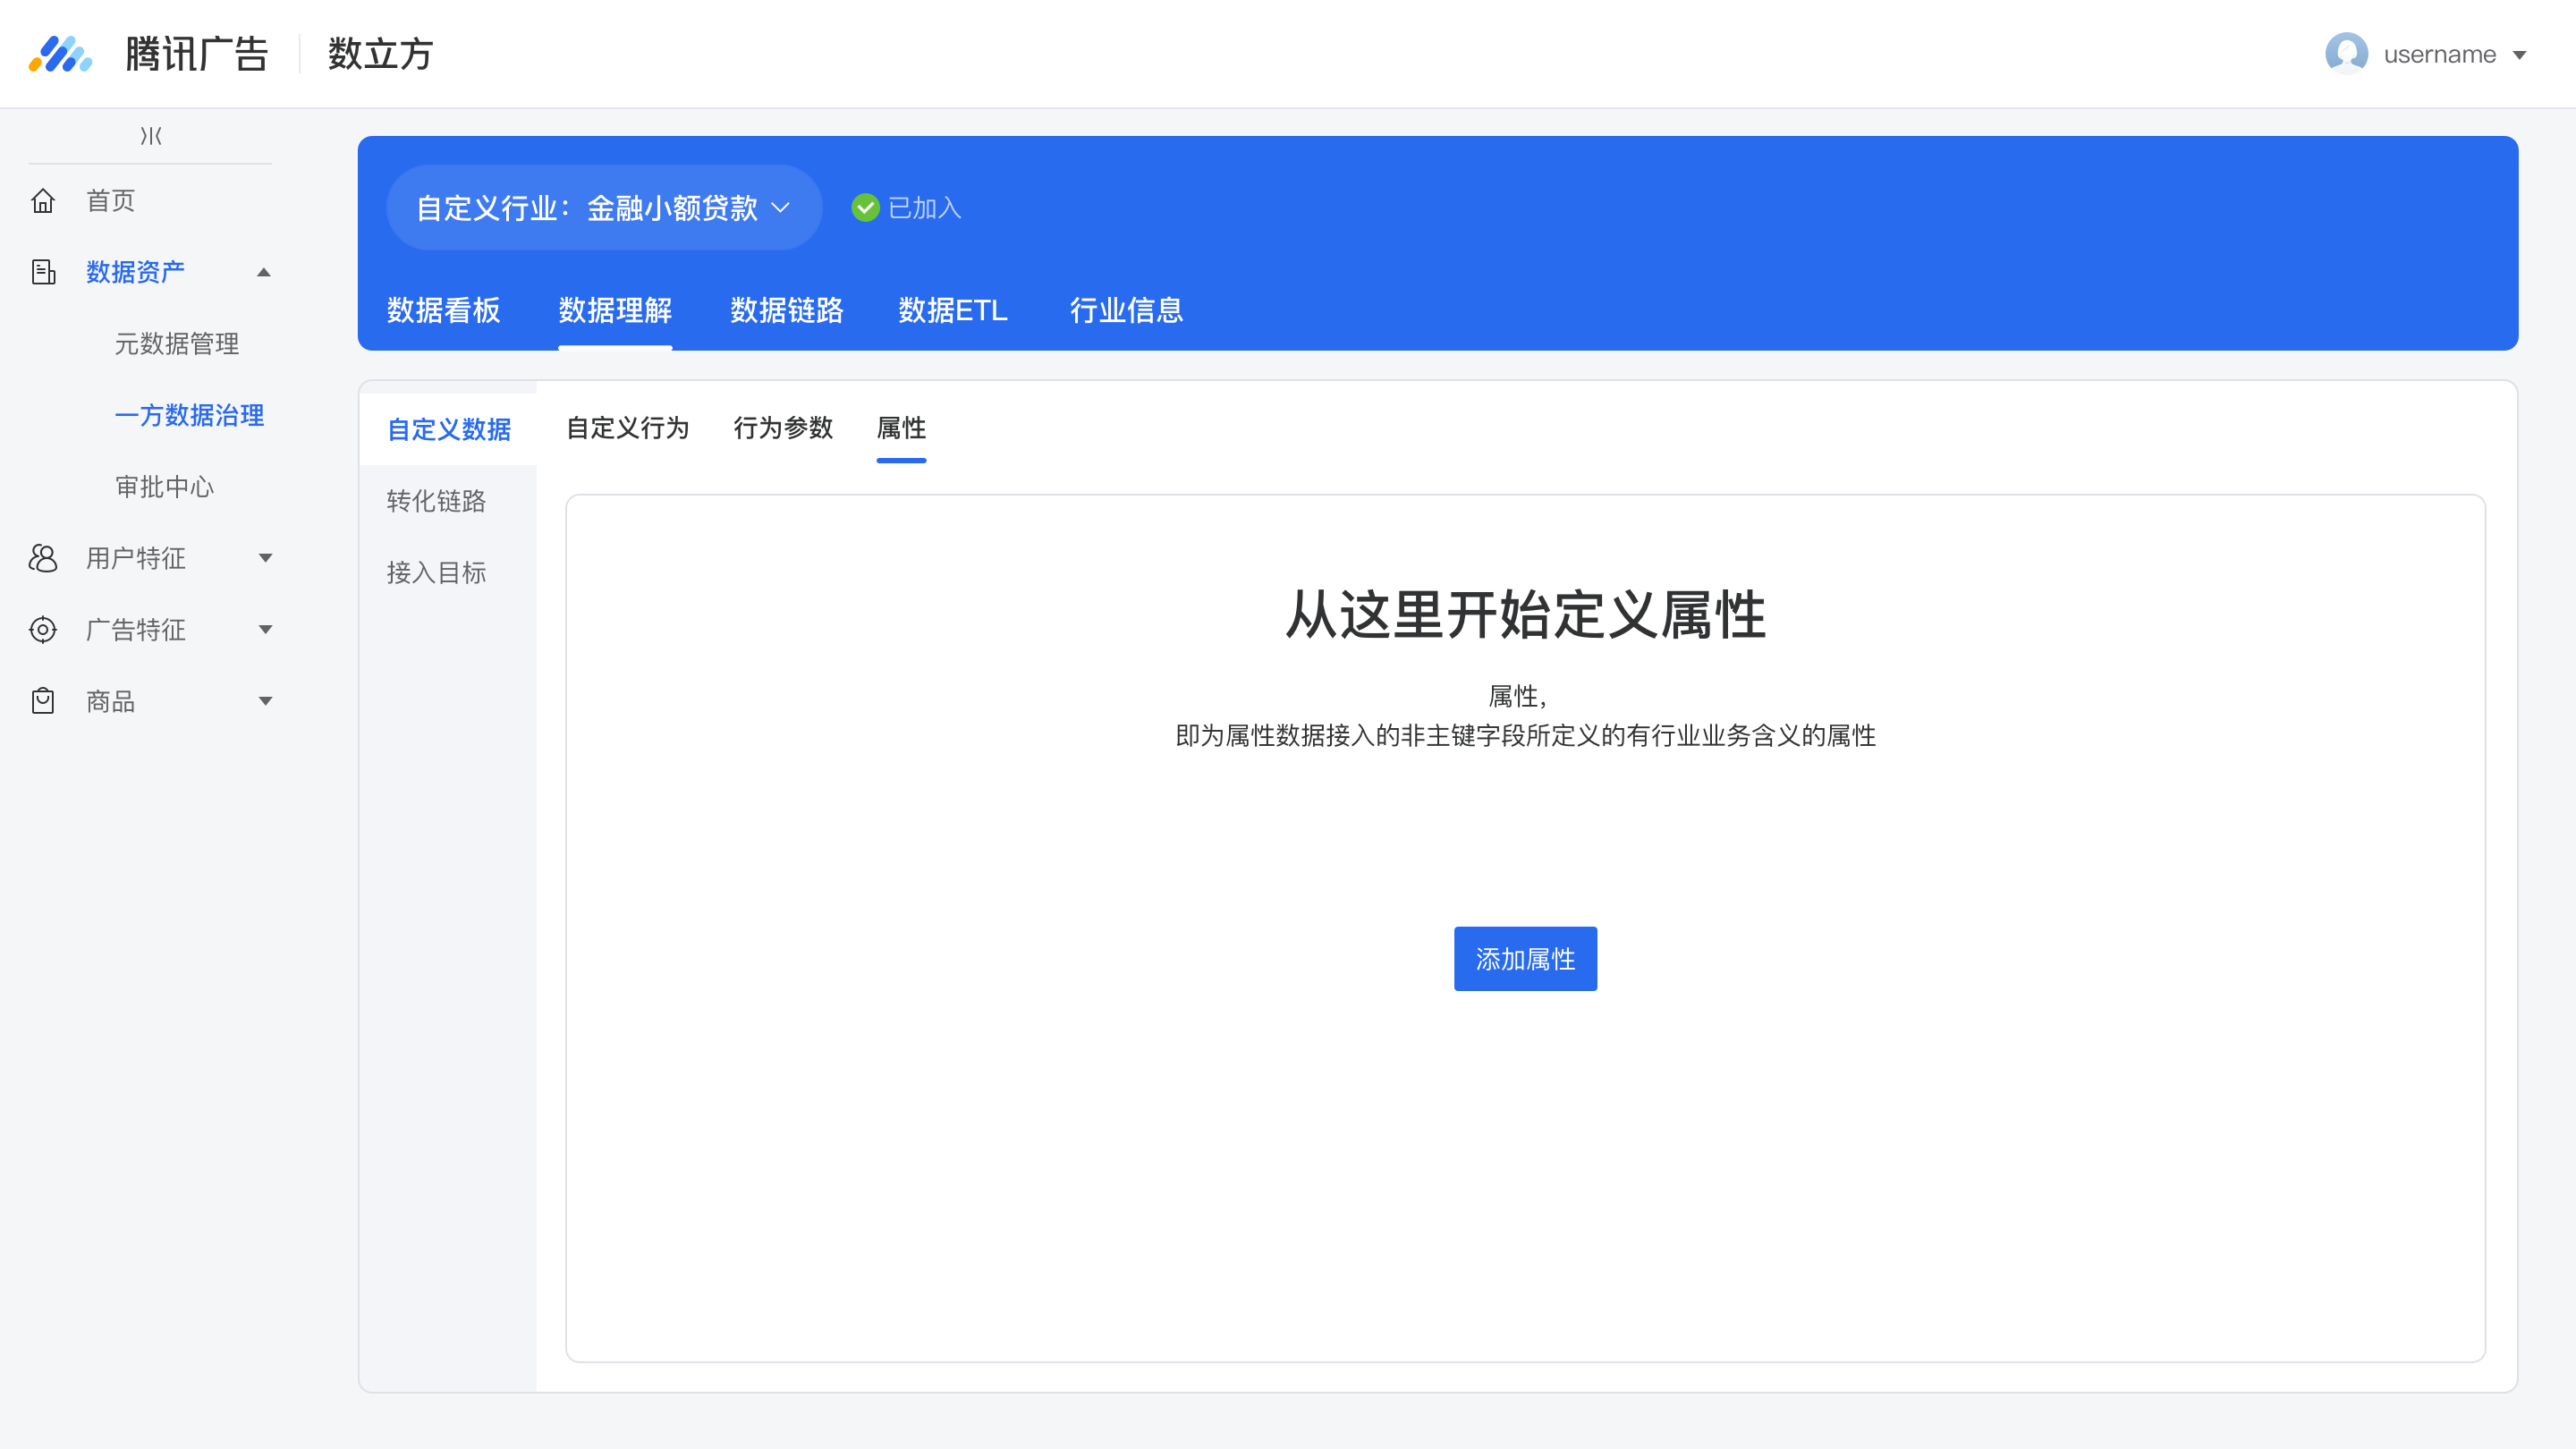
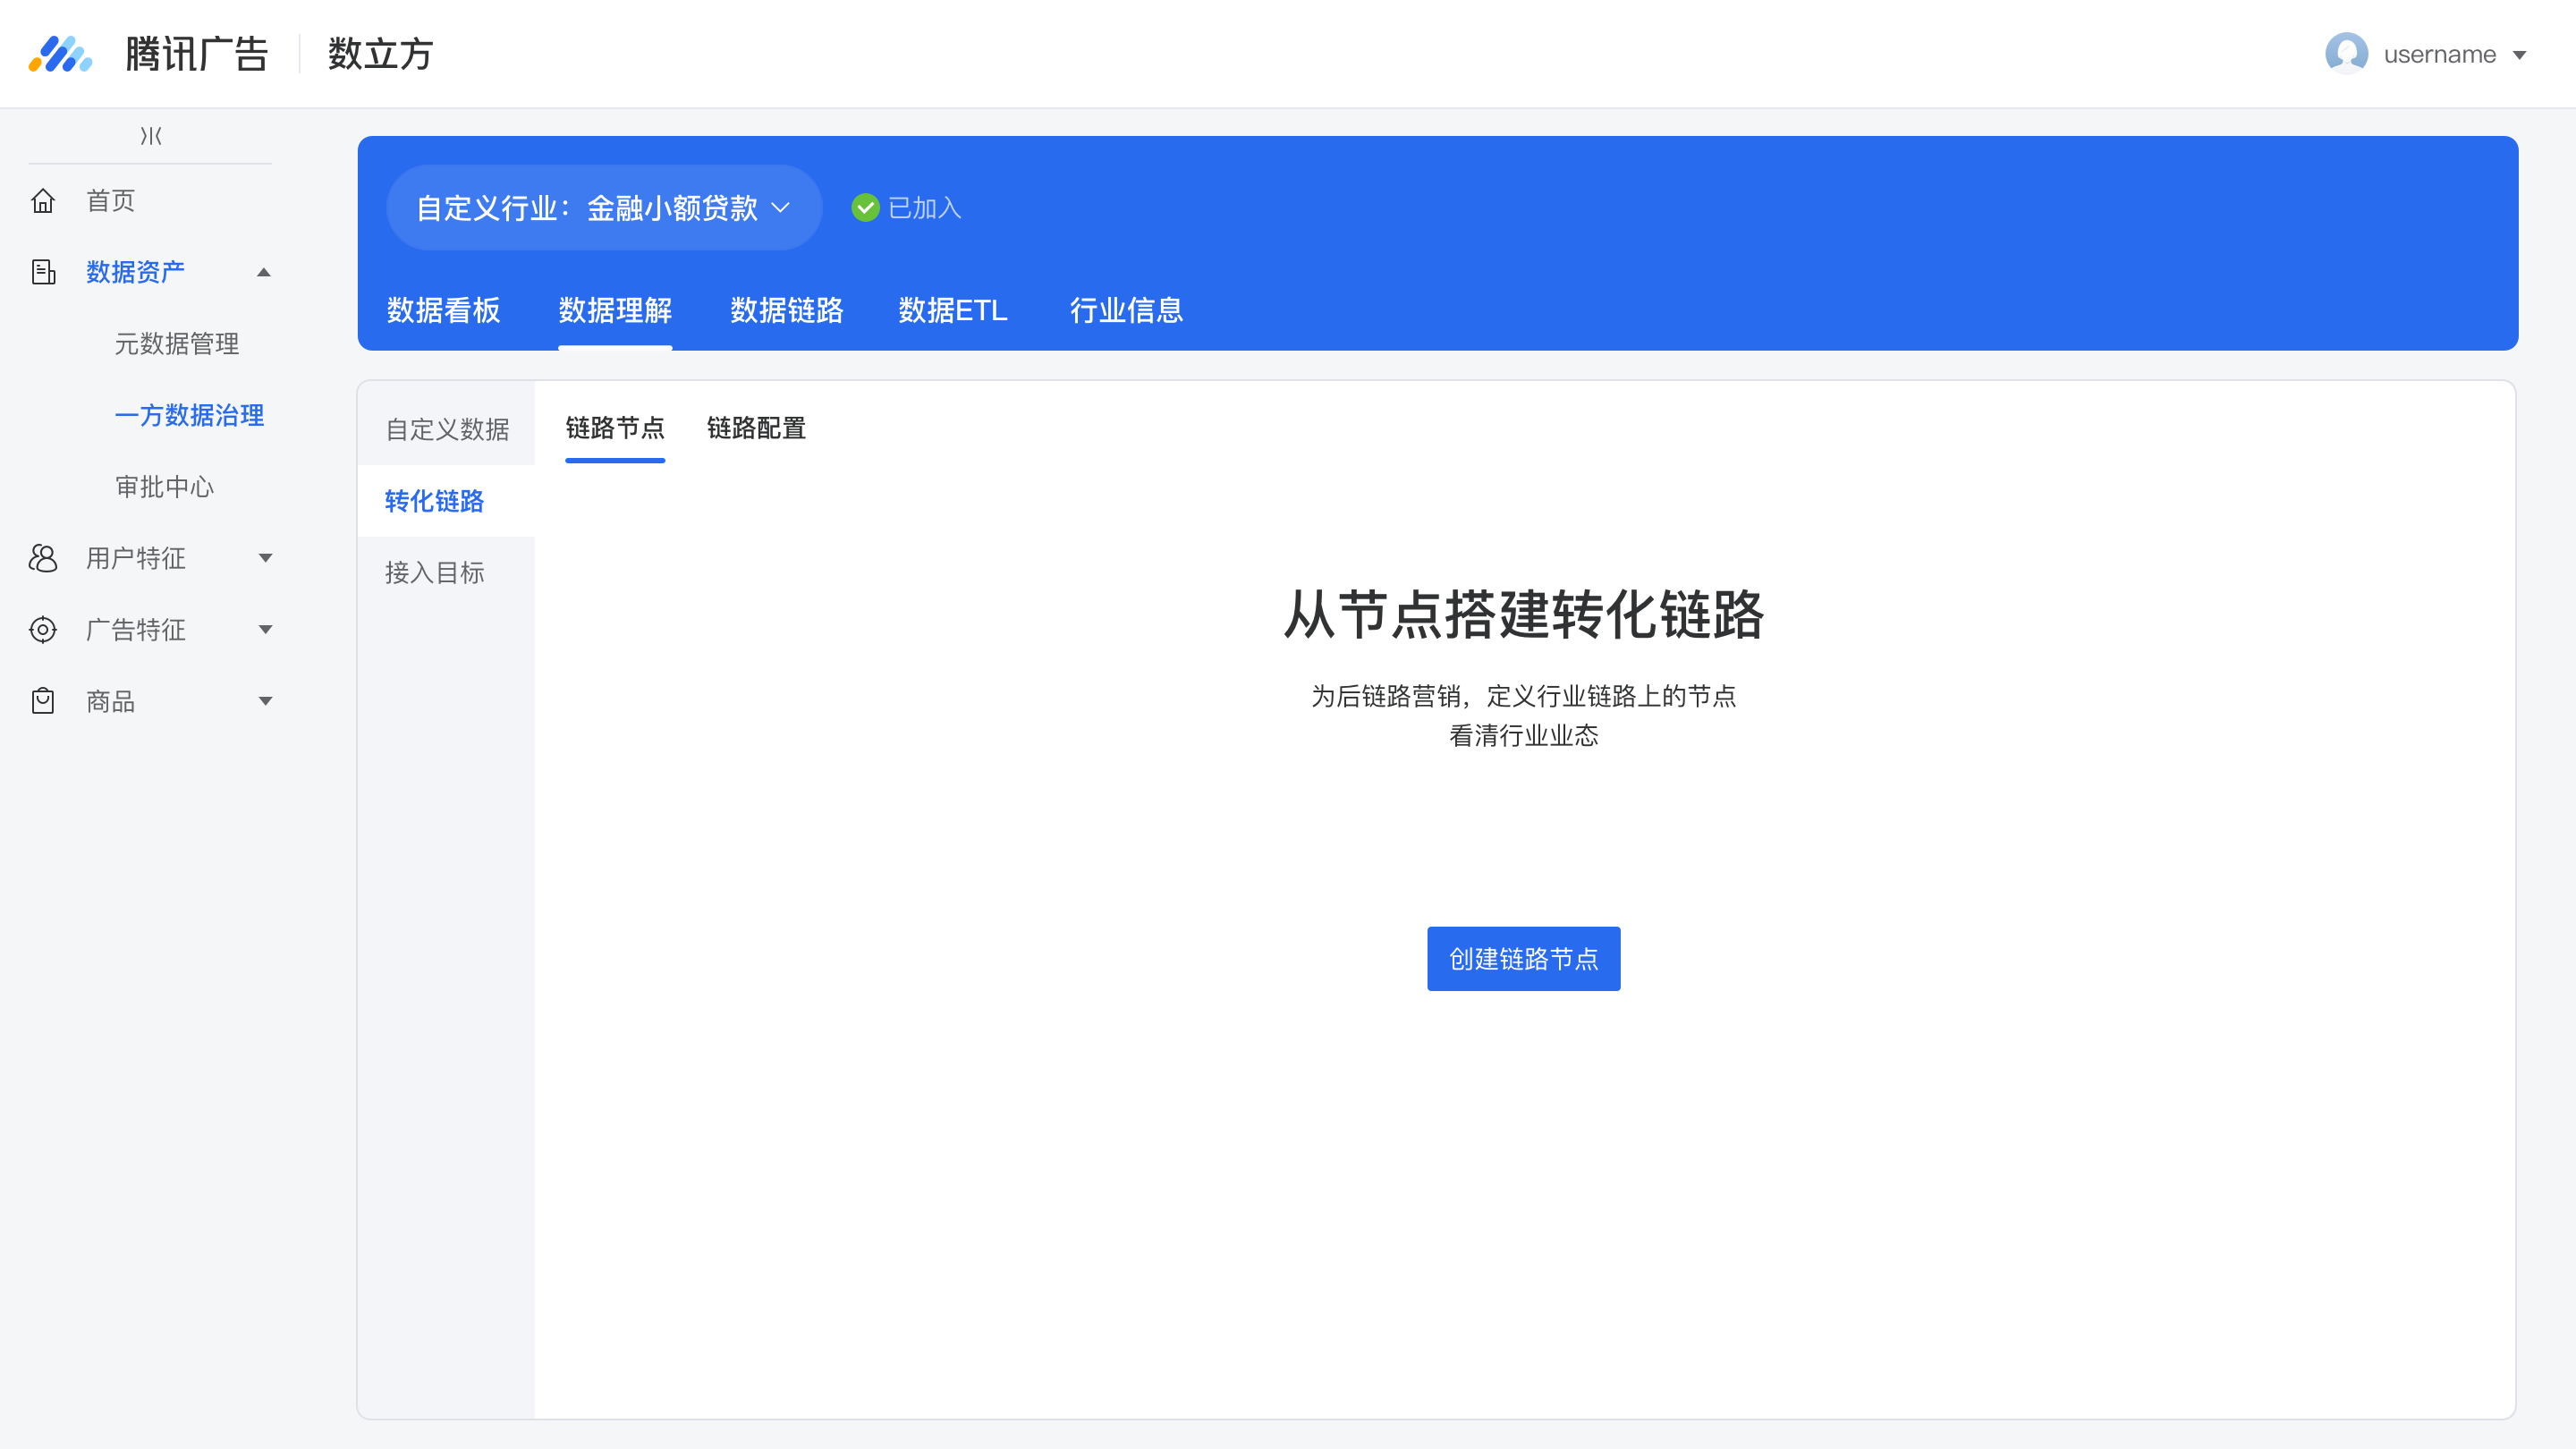
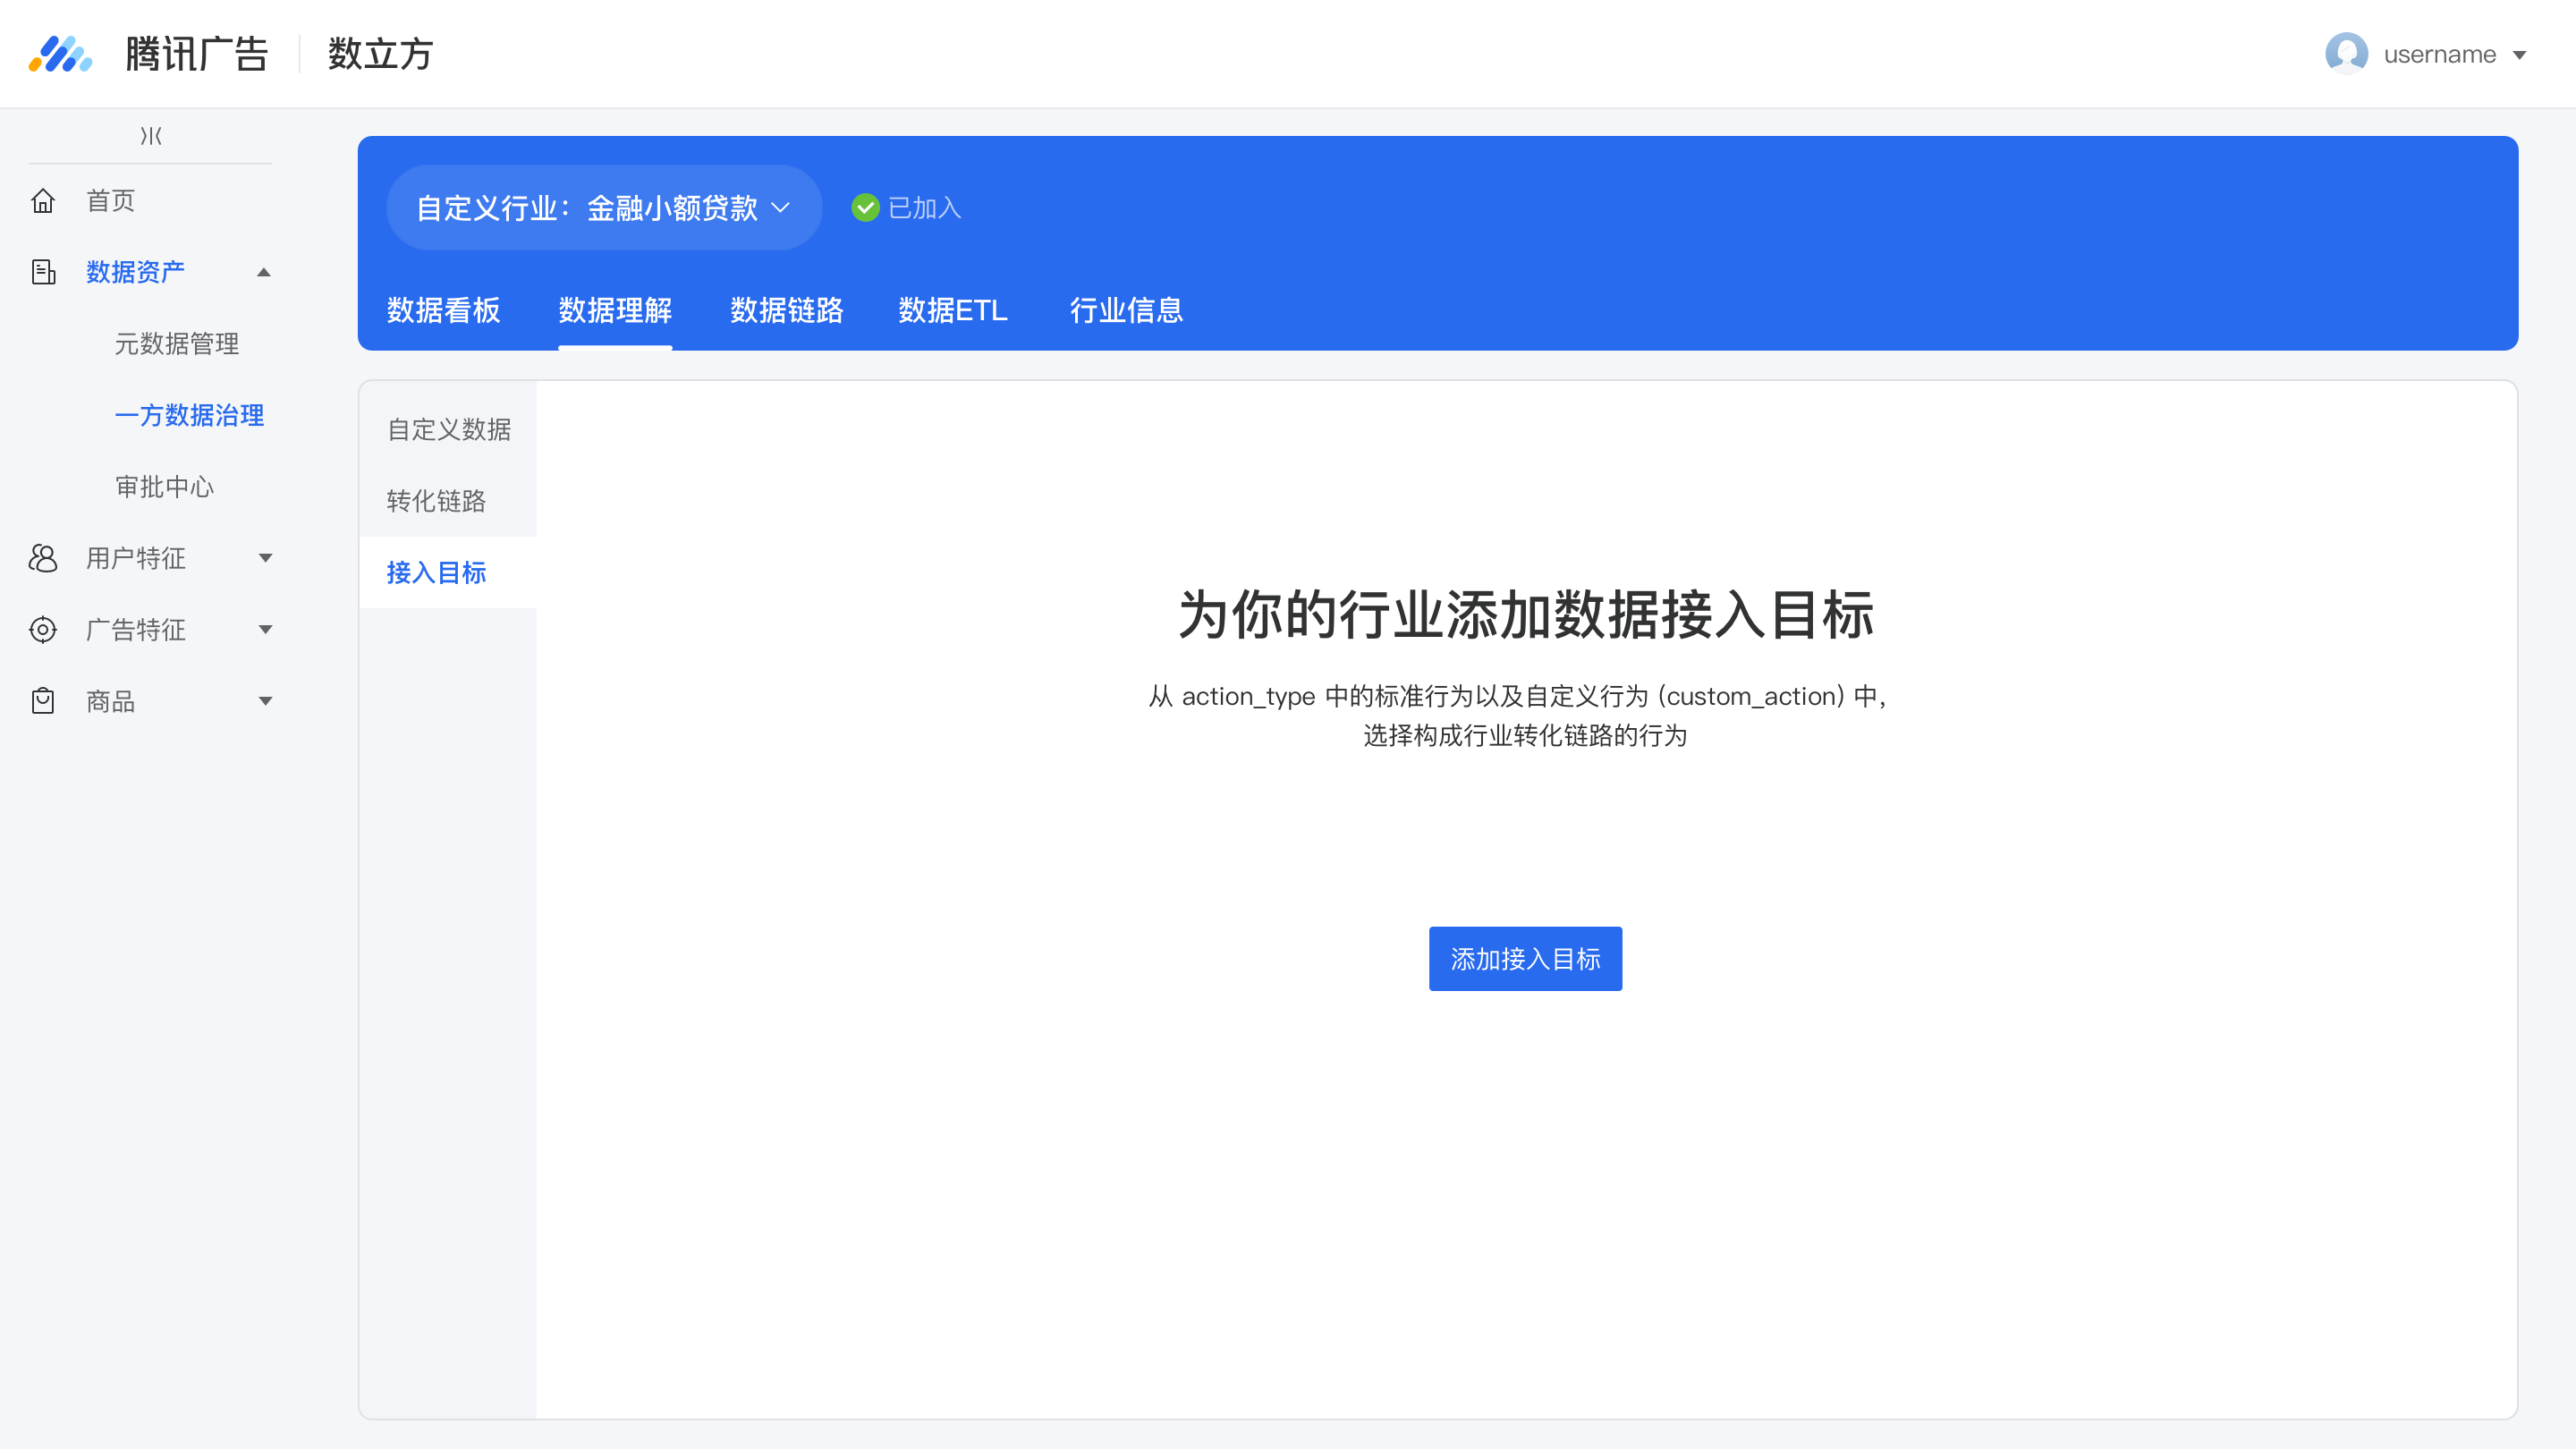
First Time Use
The page template for Industry Creation includes all first-party data governance functions at the highest level.
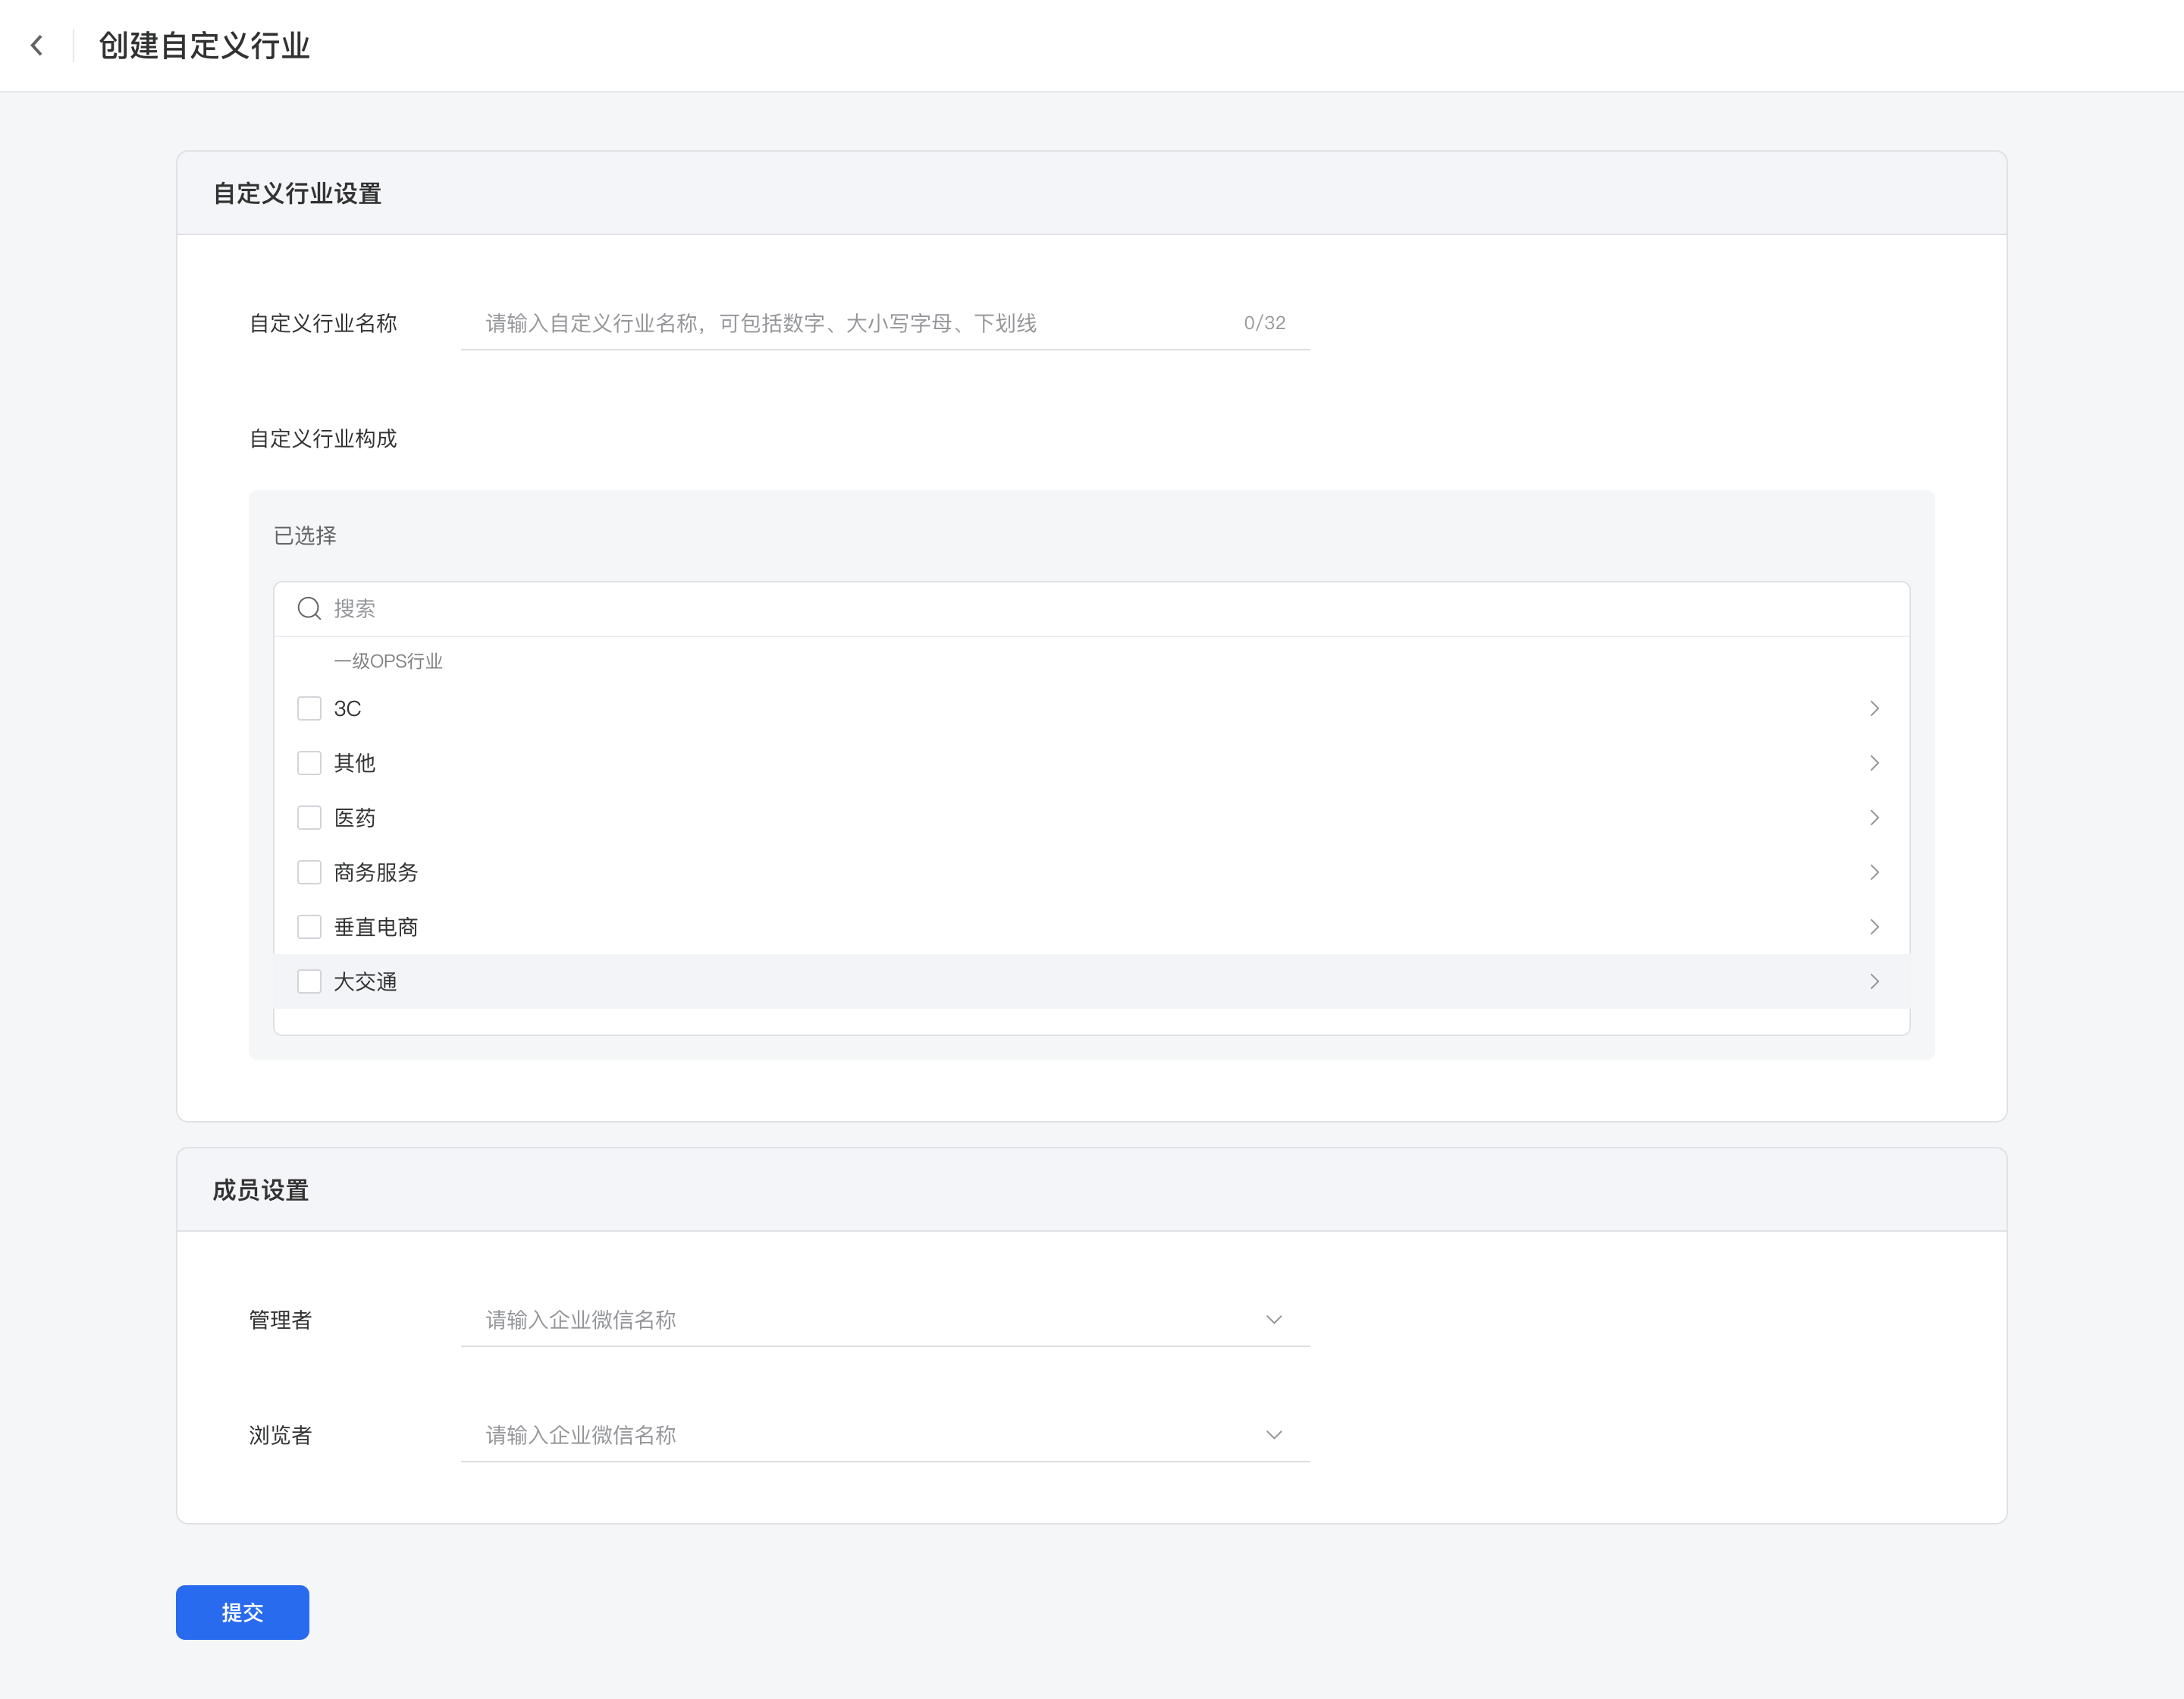
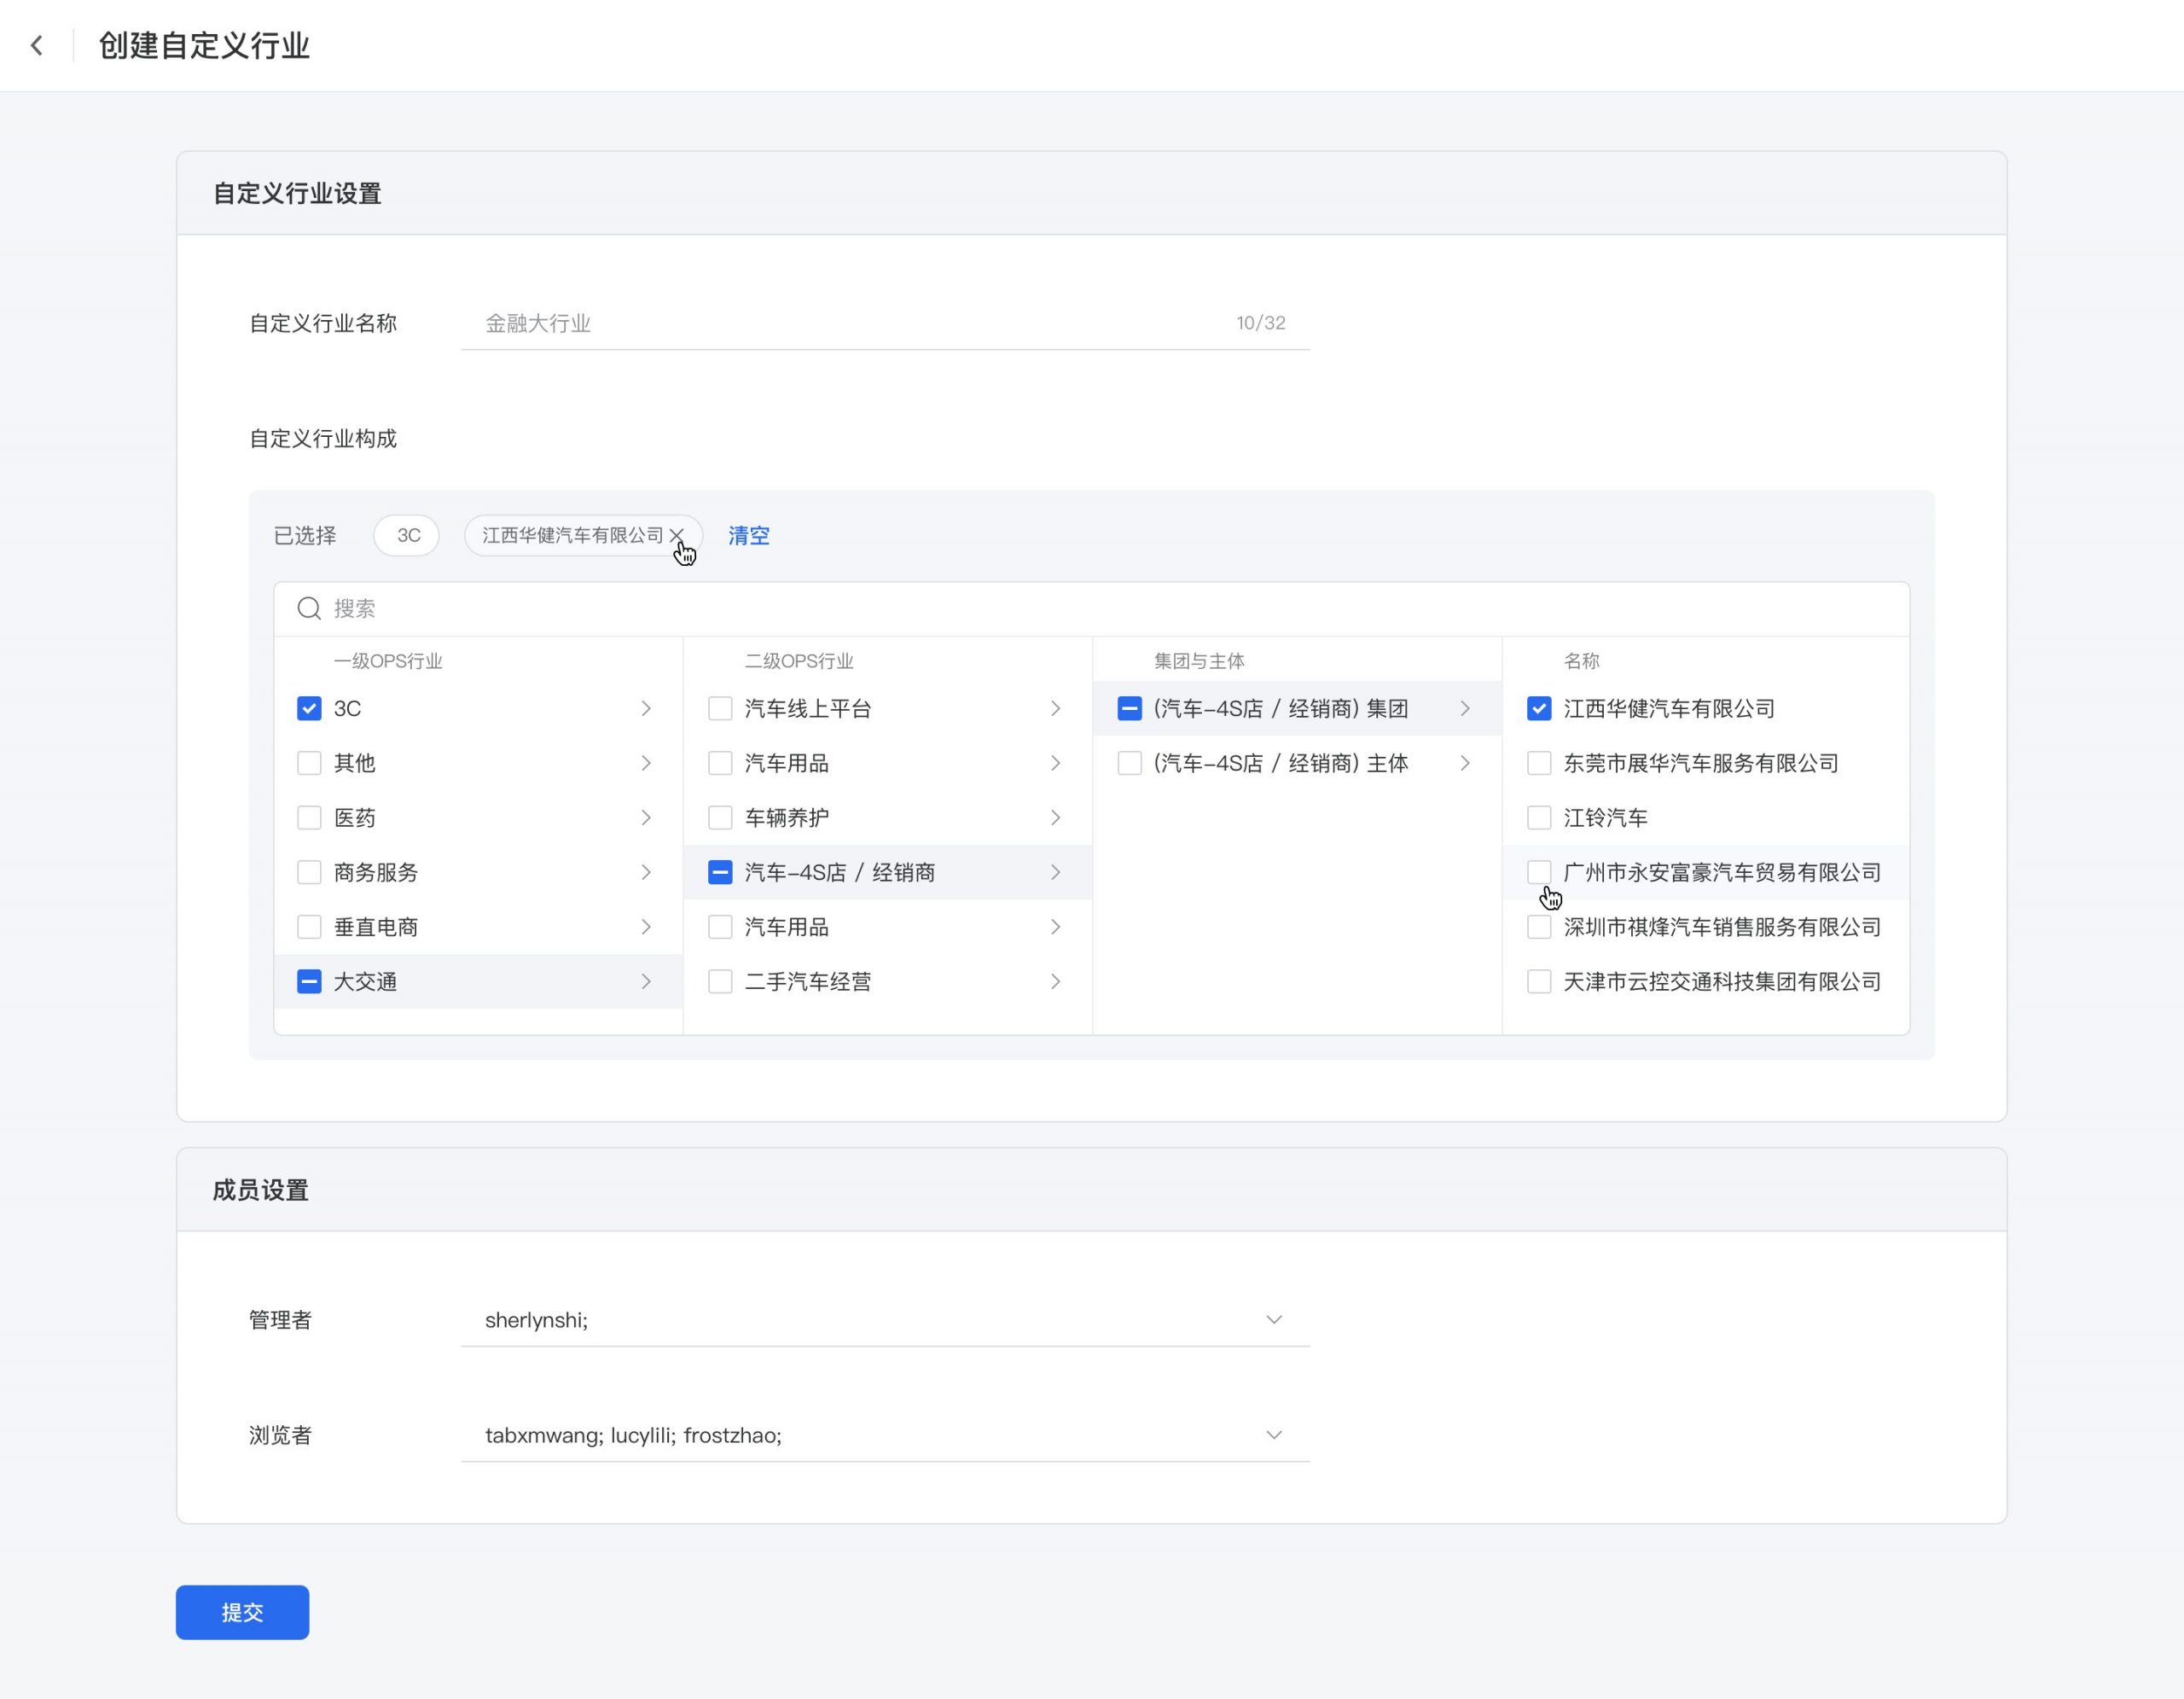

Using a Page Style
There are three basic user flows that make use of popup templates: the user flow of Customized Action Types, Action Parameters, and Action Attributes. These flows consist of the three types of basic tasks that form the nodes for building Conversion Paths and data ingestion volume targets. The fields in these flows are quite similar and are not numerous.
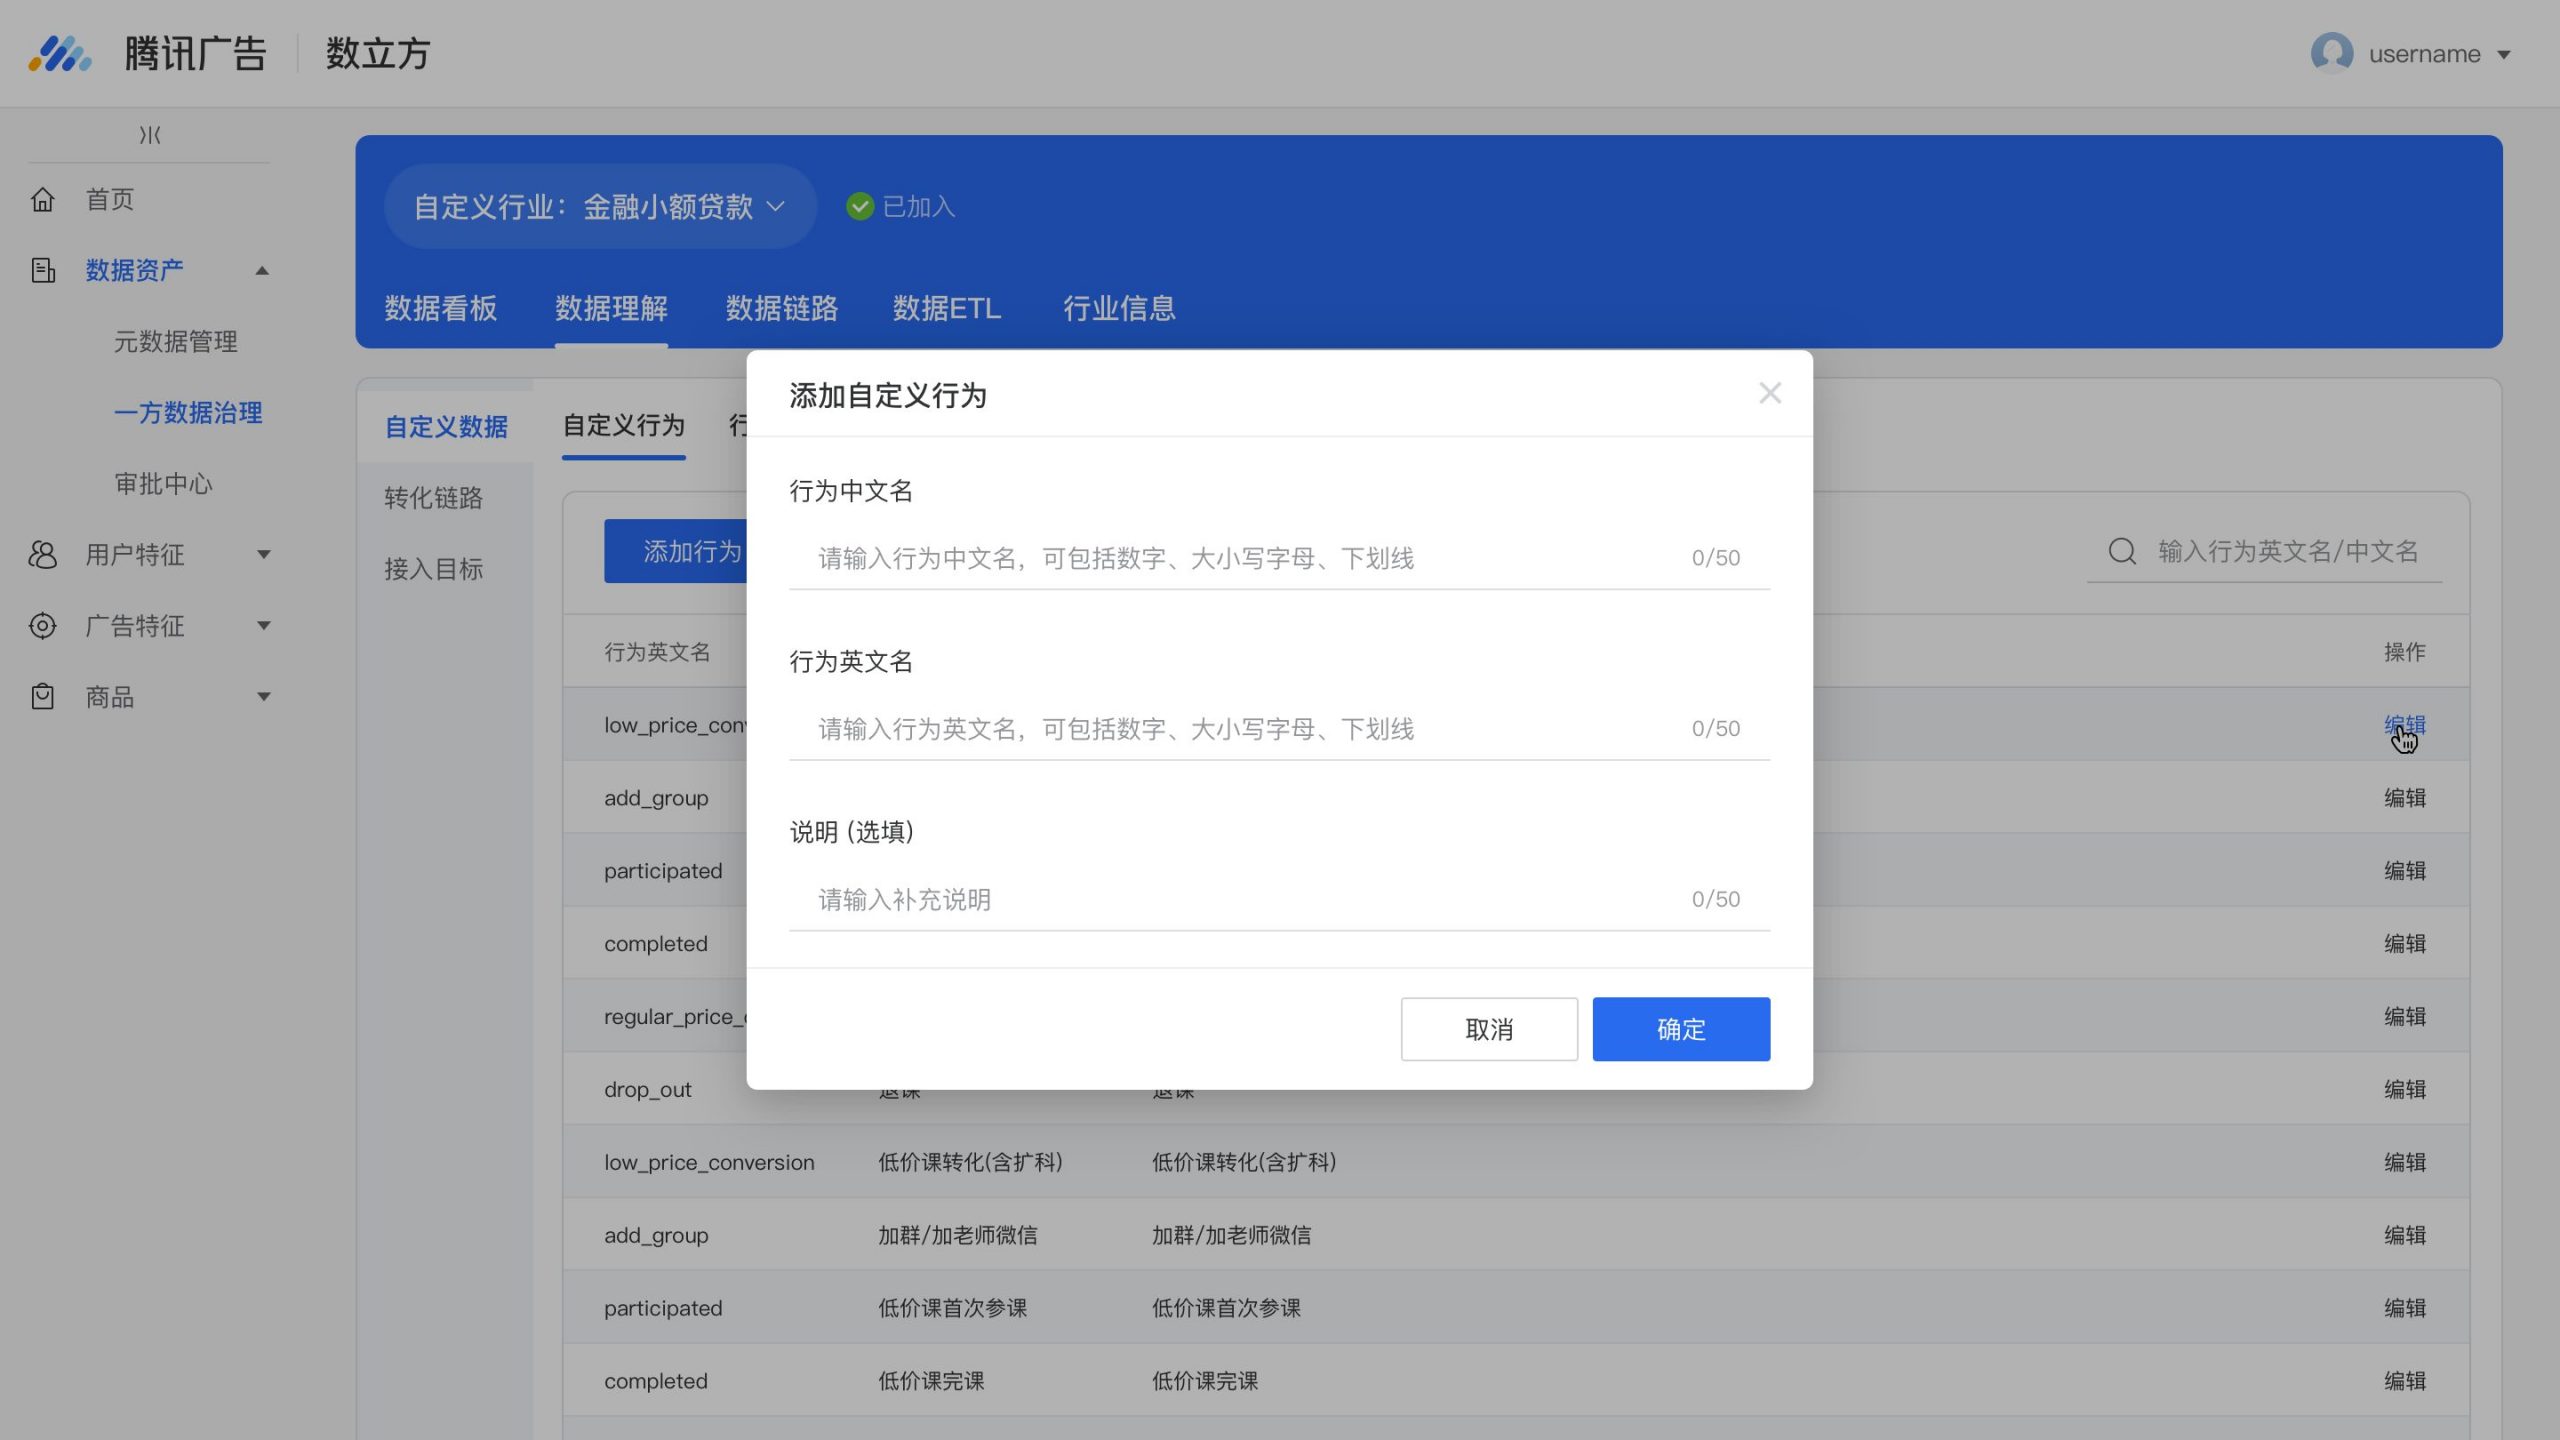
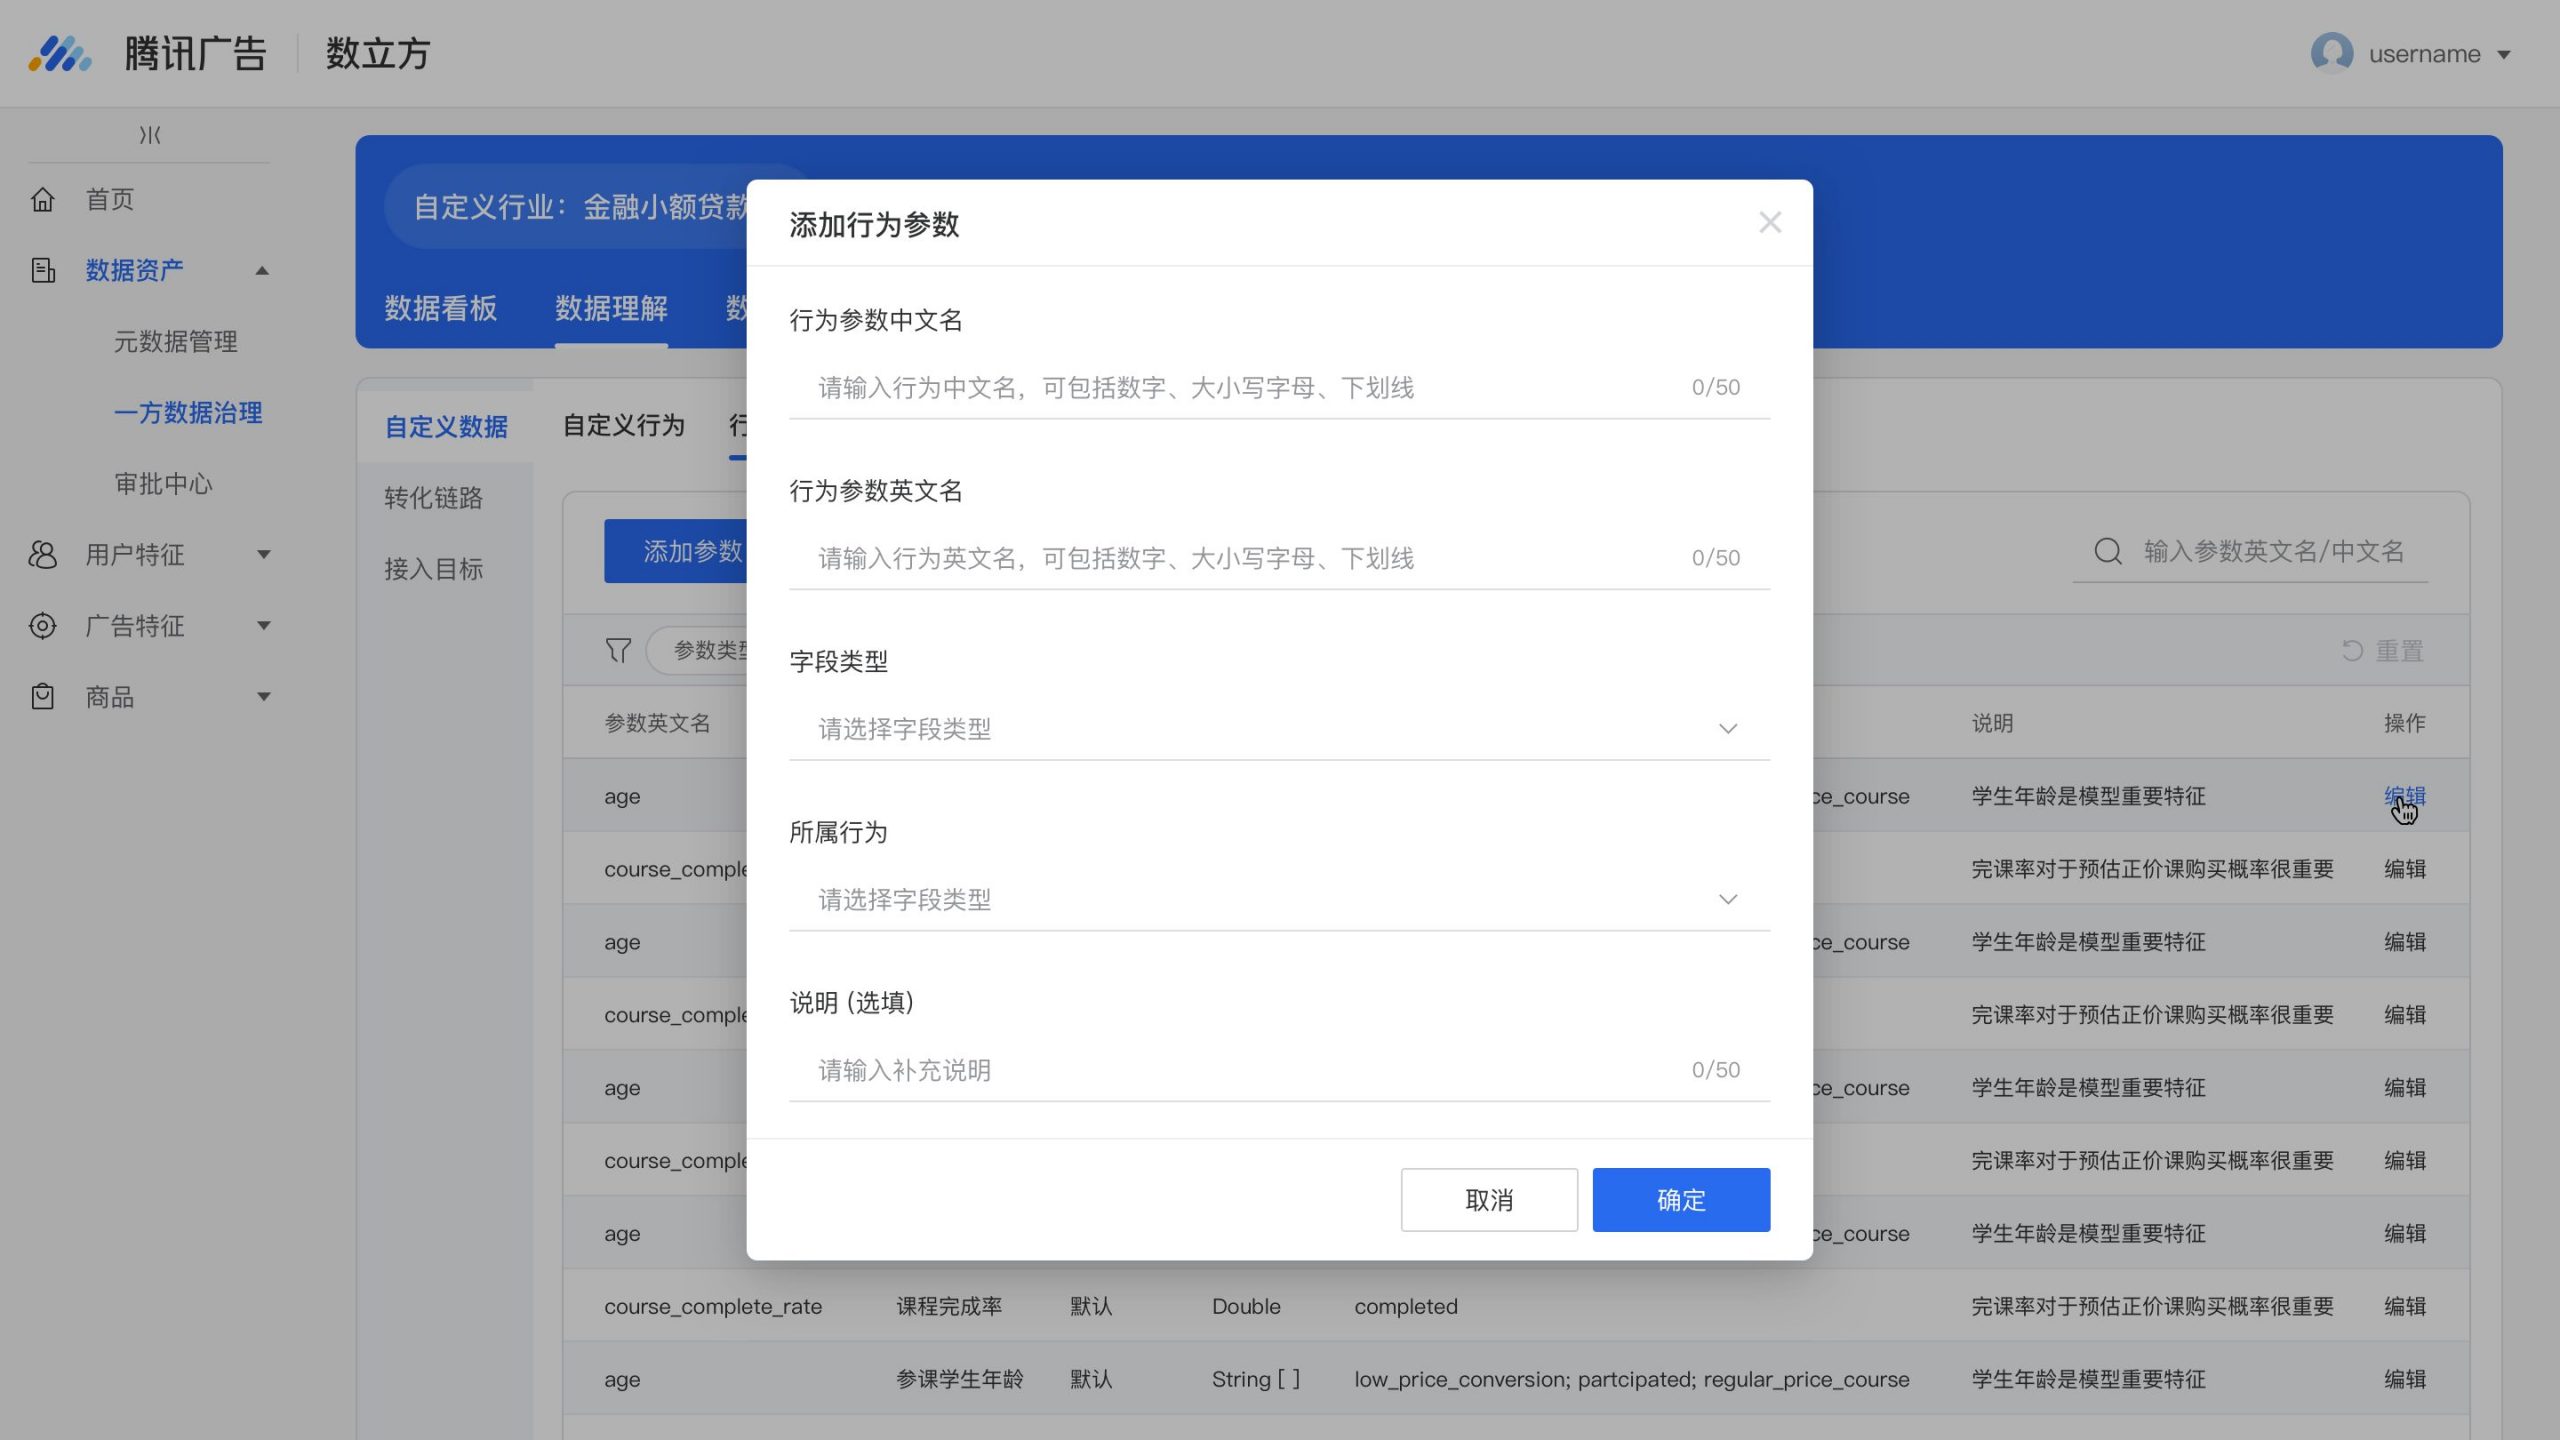
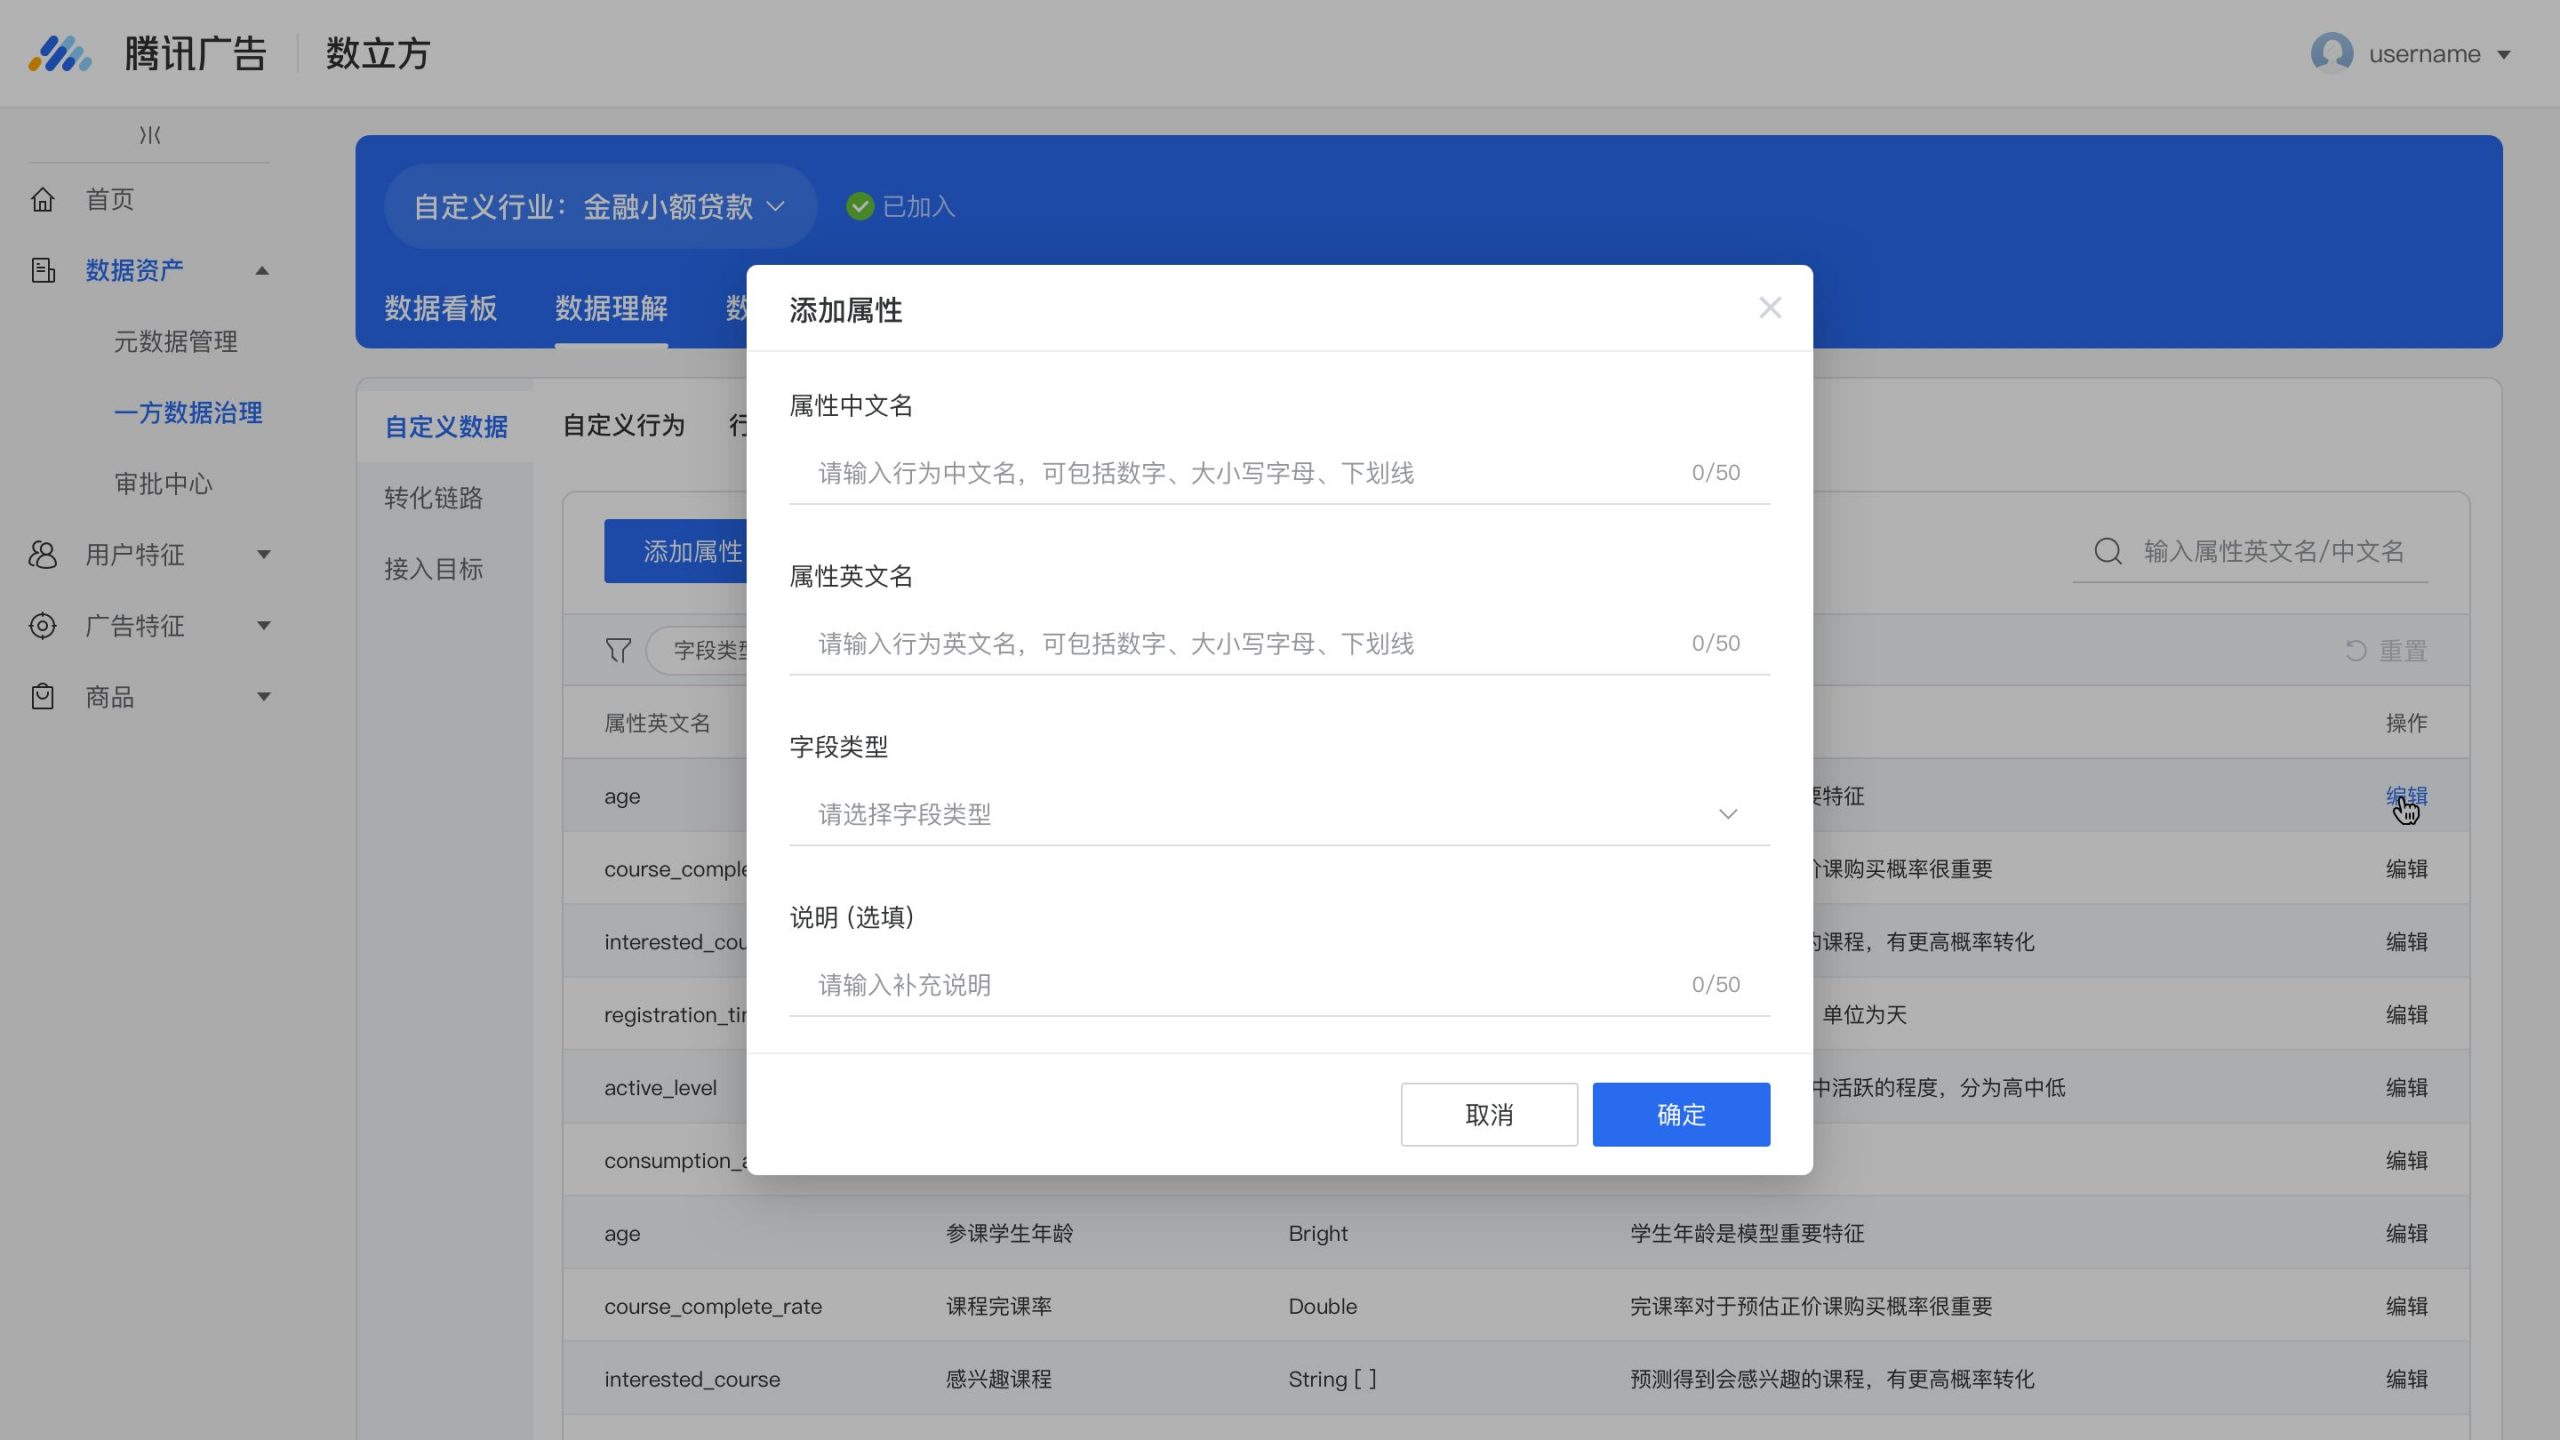
Using a Dialog Style
The card template is an integral part of the user flow in Conversion Paths. In any given industry, there may be several Conversion Paths, each with a varying number of nodes. In such cases, the product manager expects to communicate the idea of a 'sequence of paths' during the presentation.
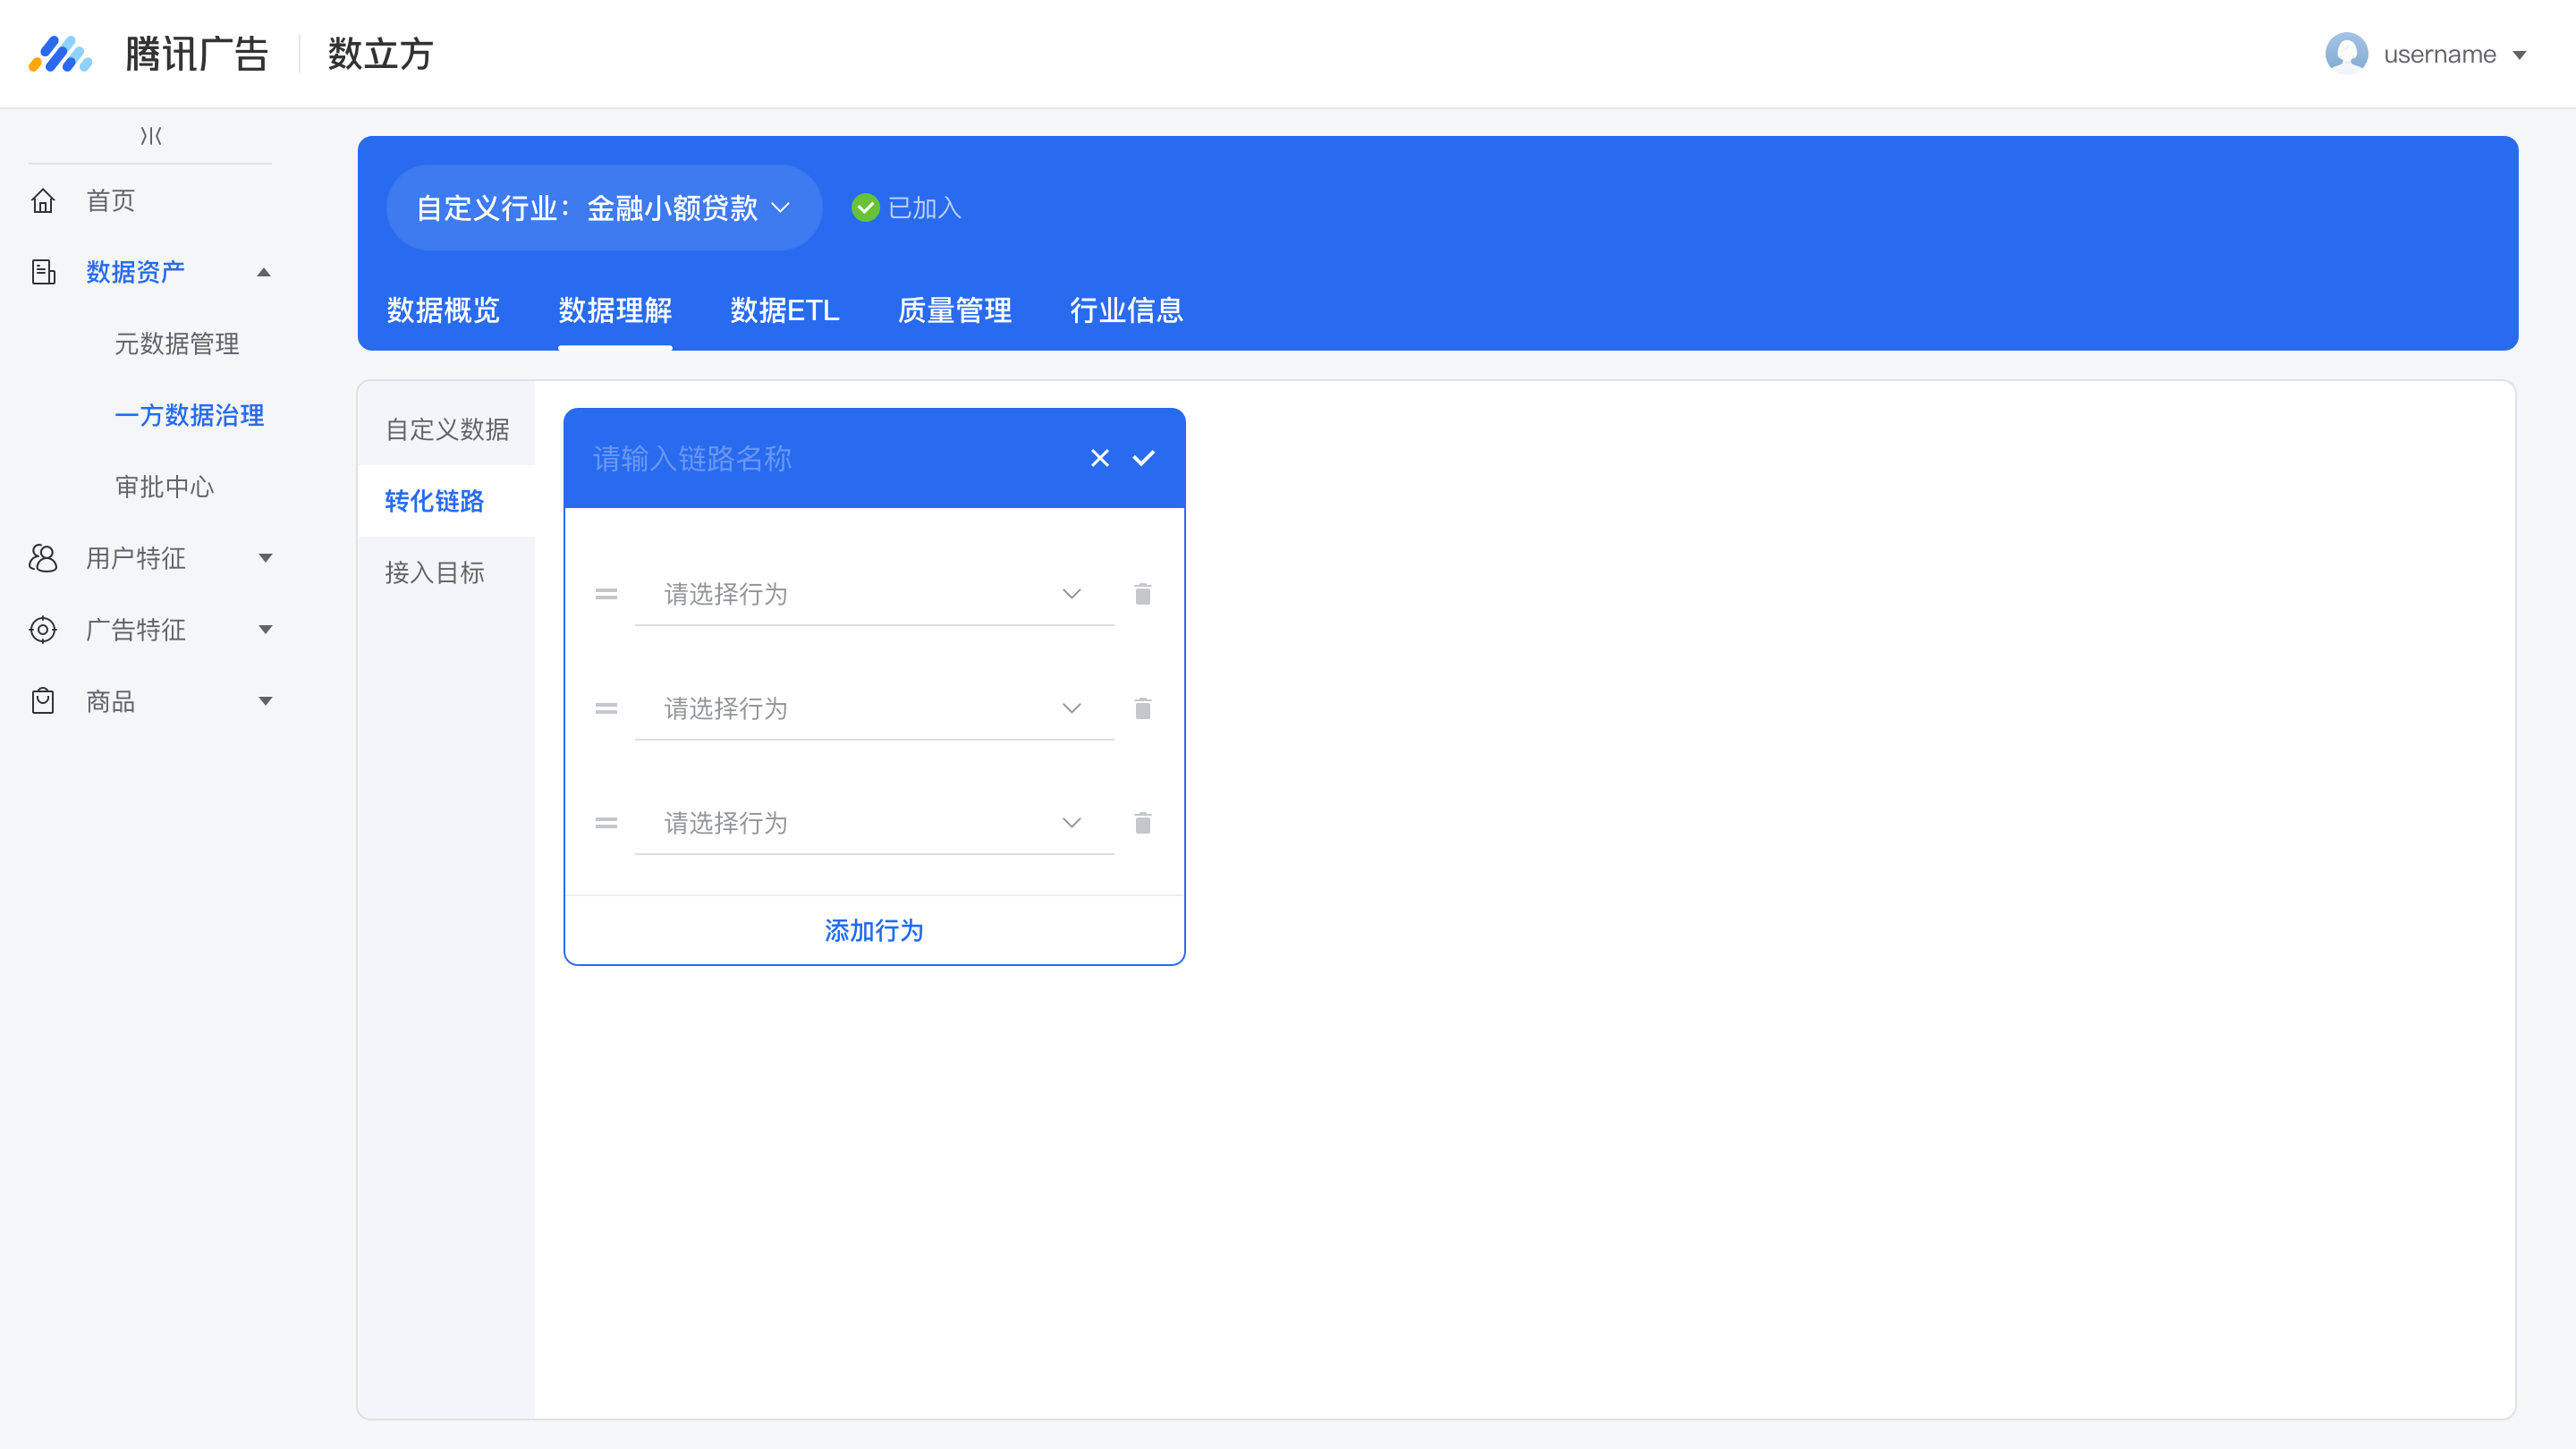
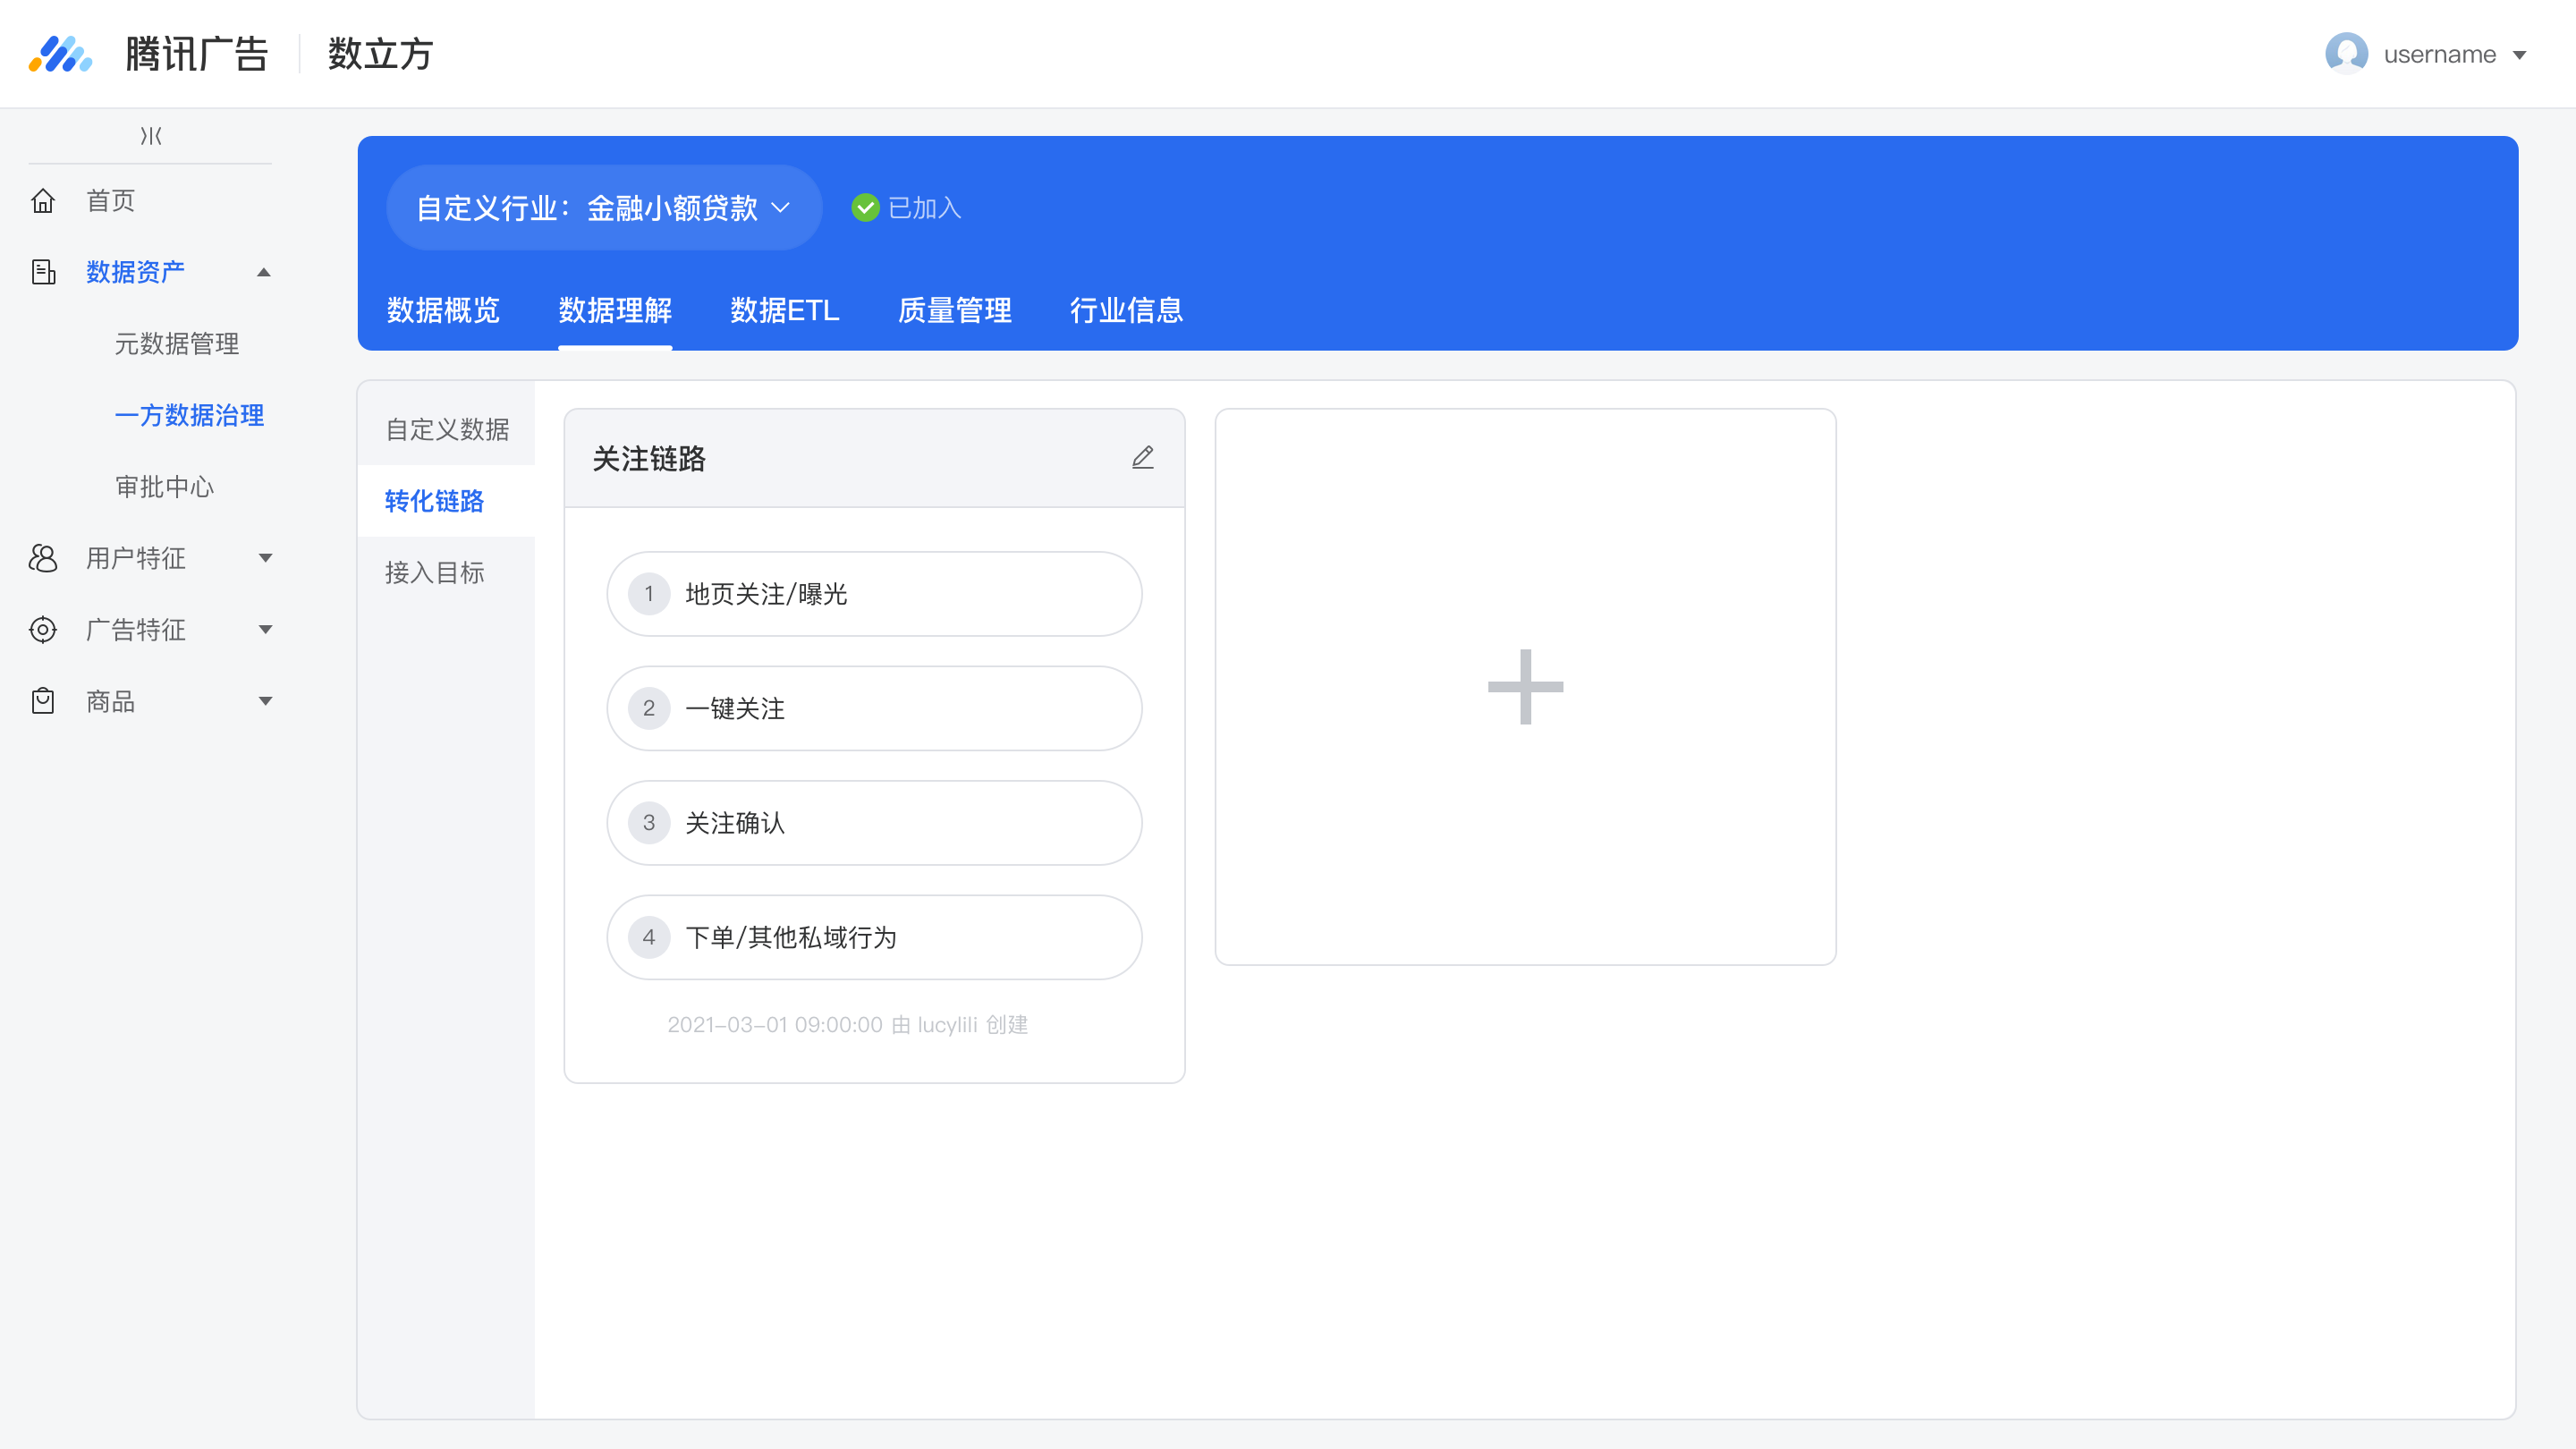
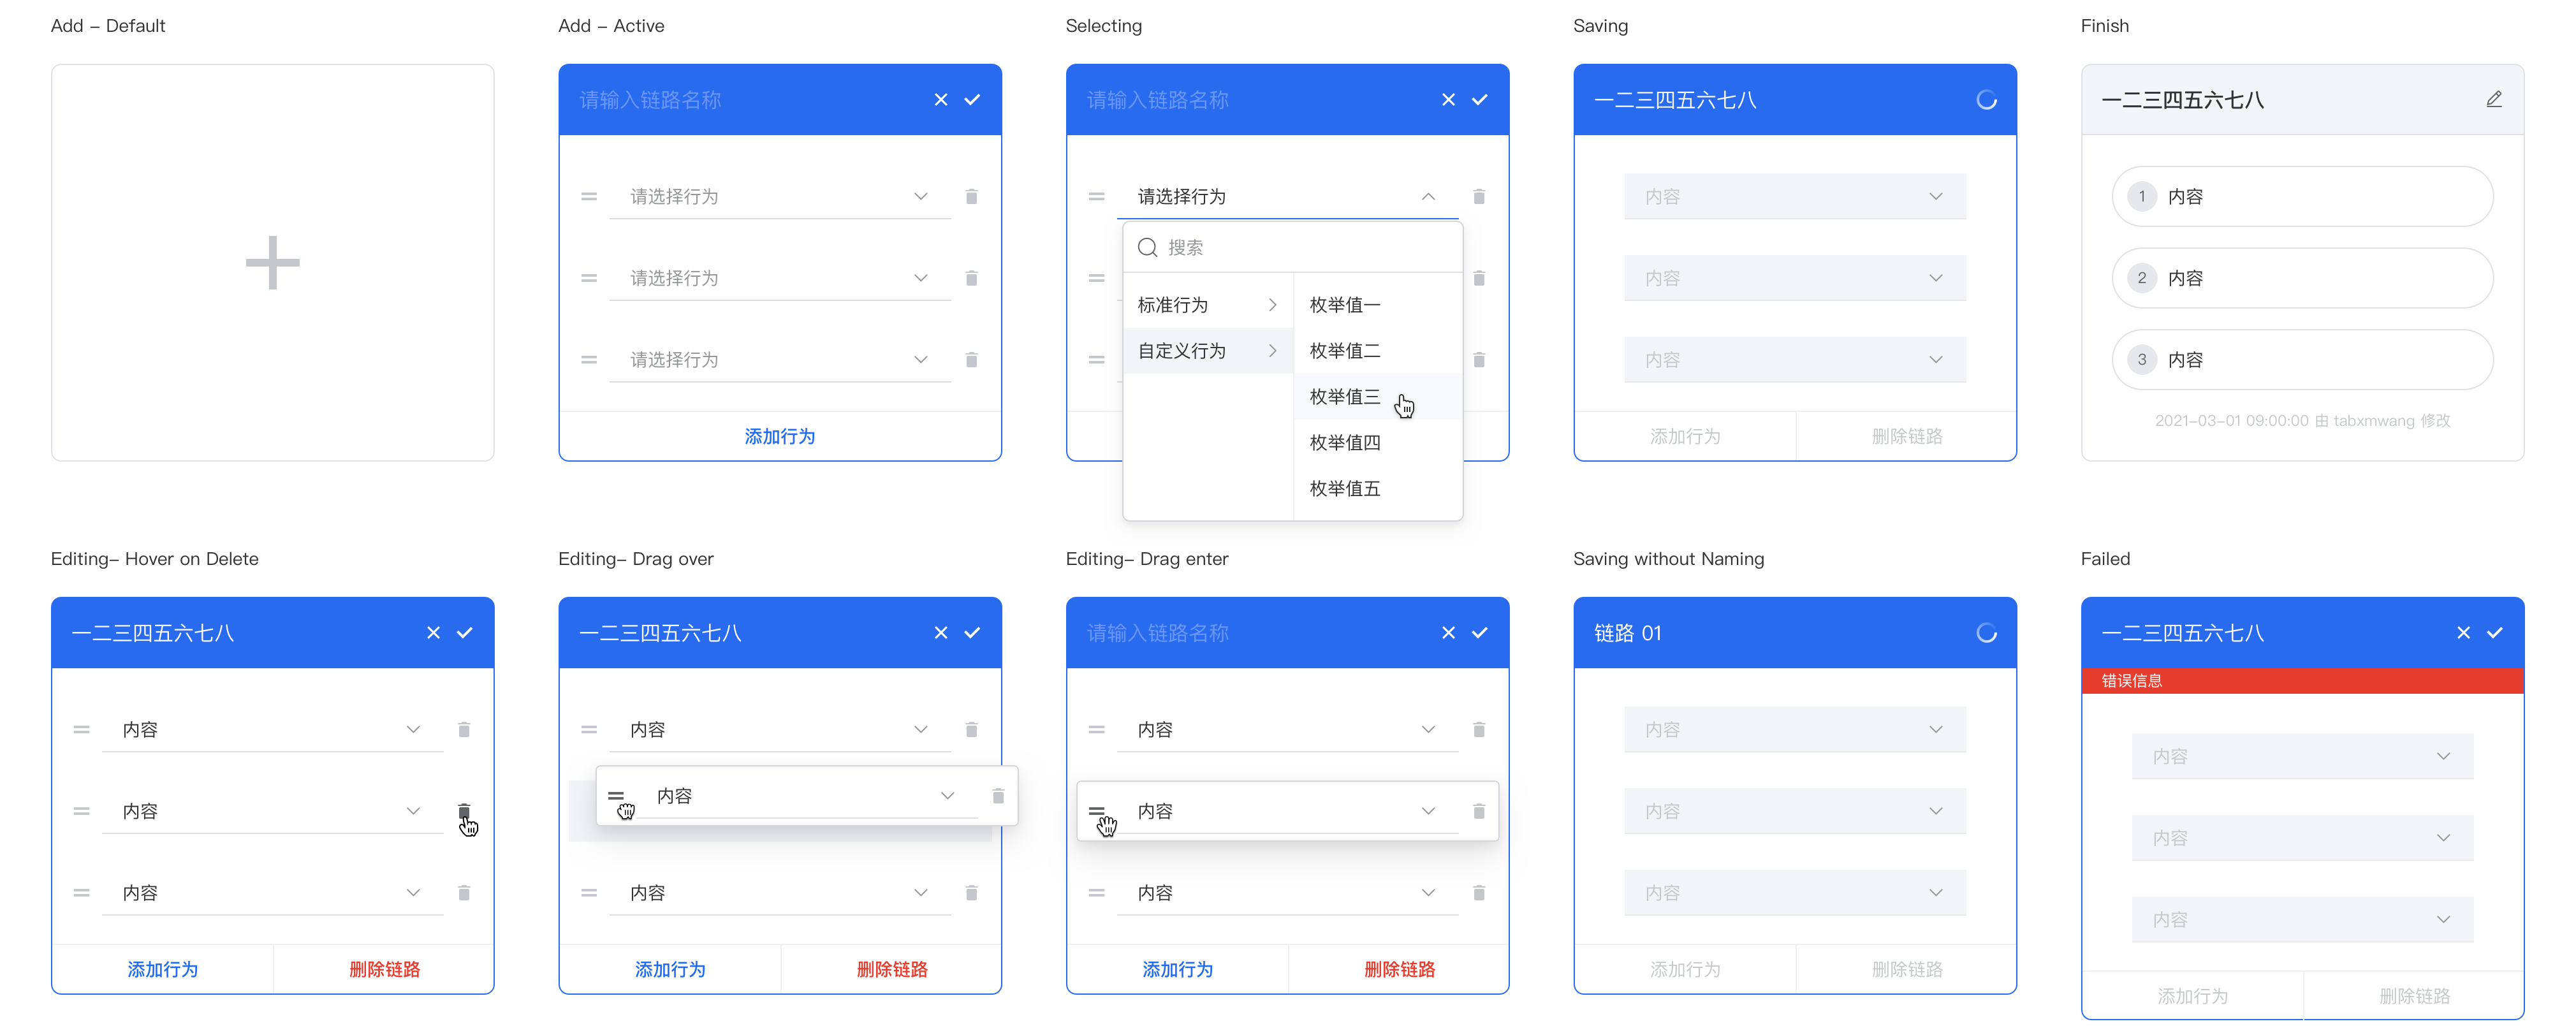
Using a Card Style
The sheet templates are an essential part of the data ingestion process. This particular form is the most complex in the entire data understanding as it contains a large number of fields, and new content can be added regularly. Consistently managing popup and card templates for this form can be challenging, but it is still within industry standards.
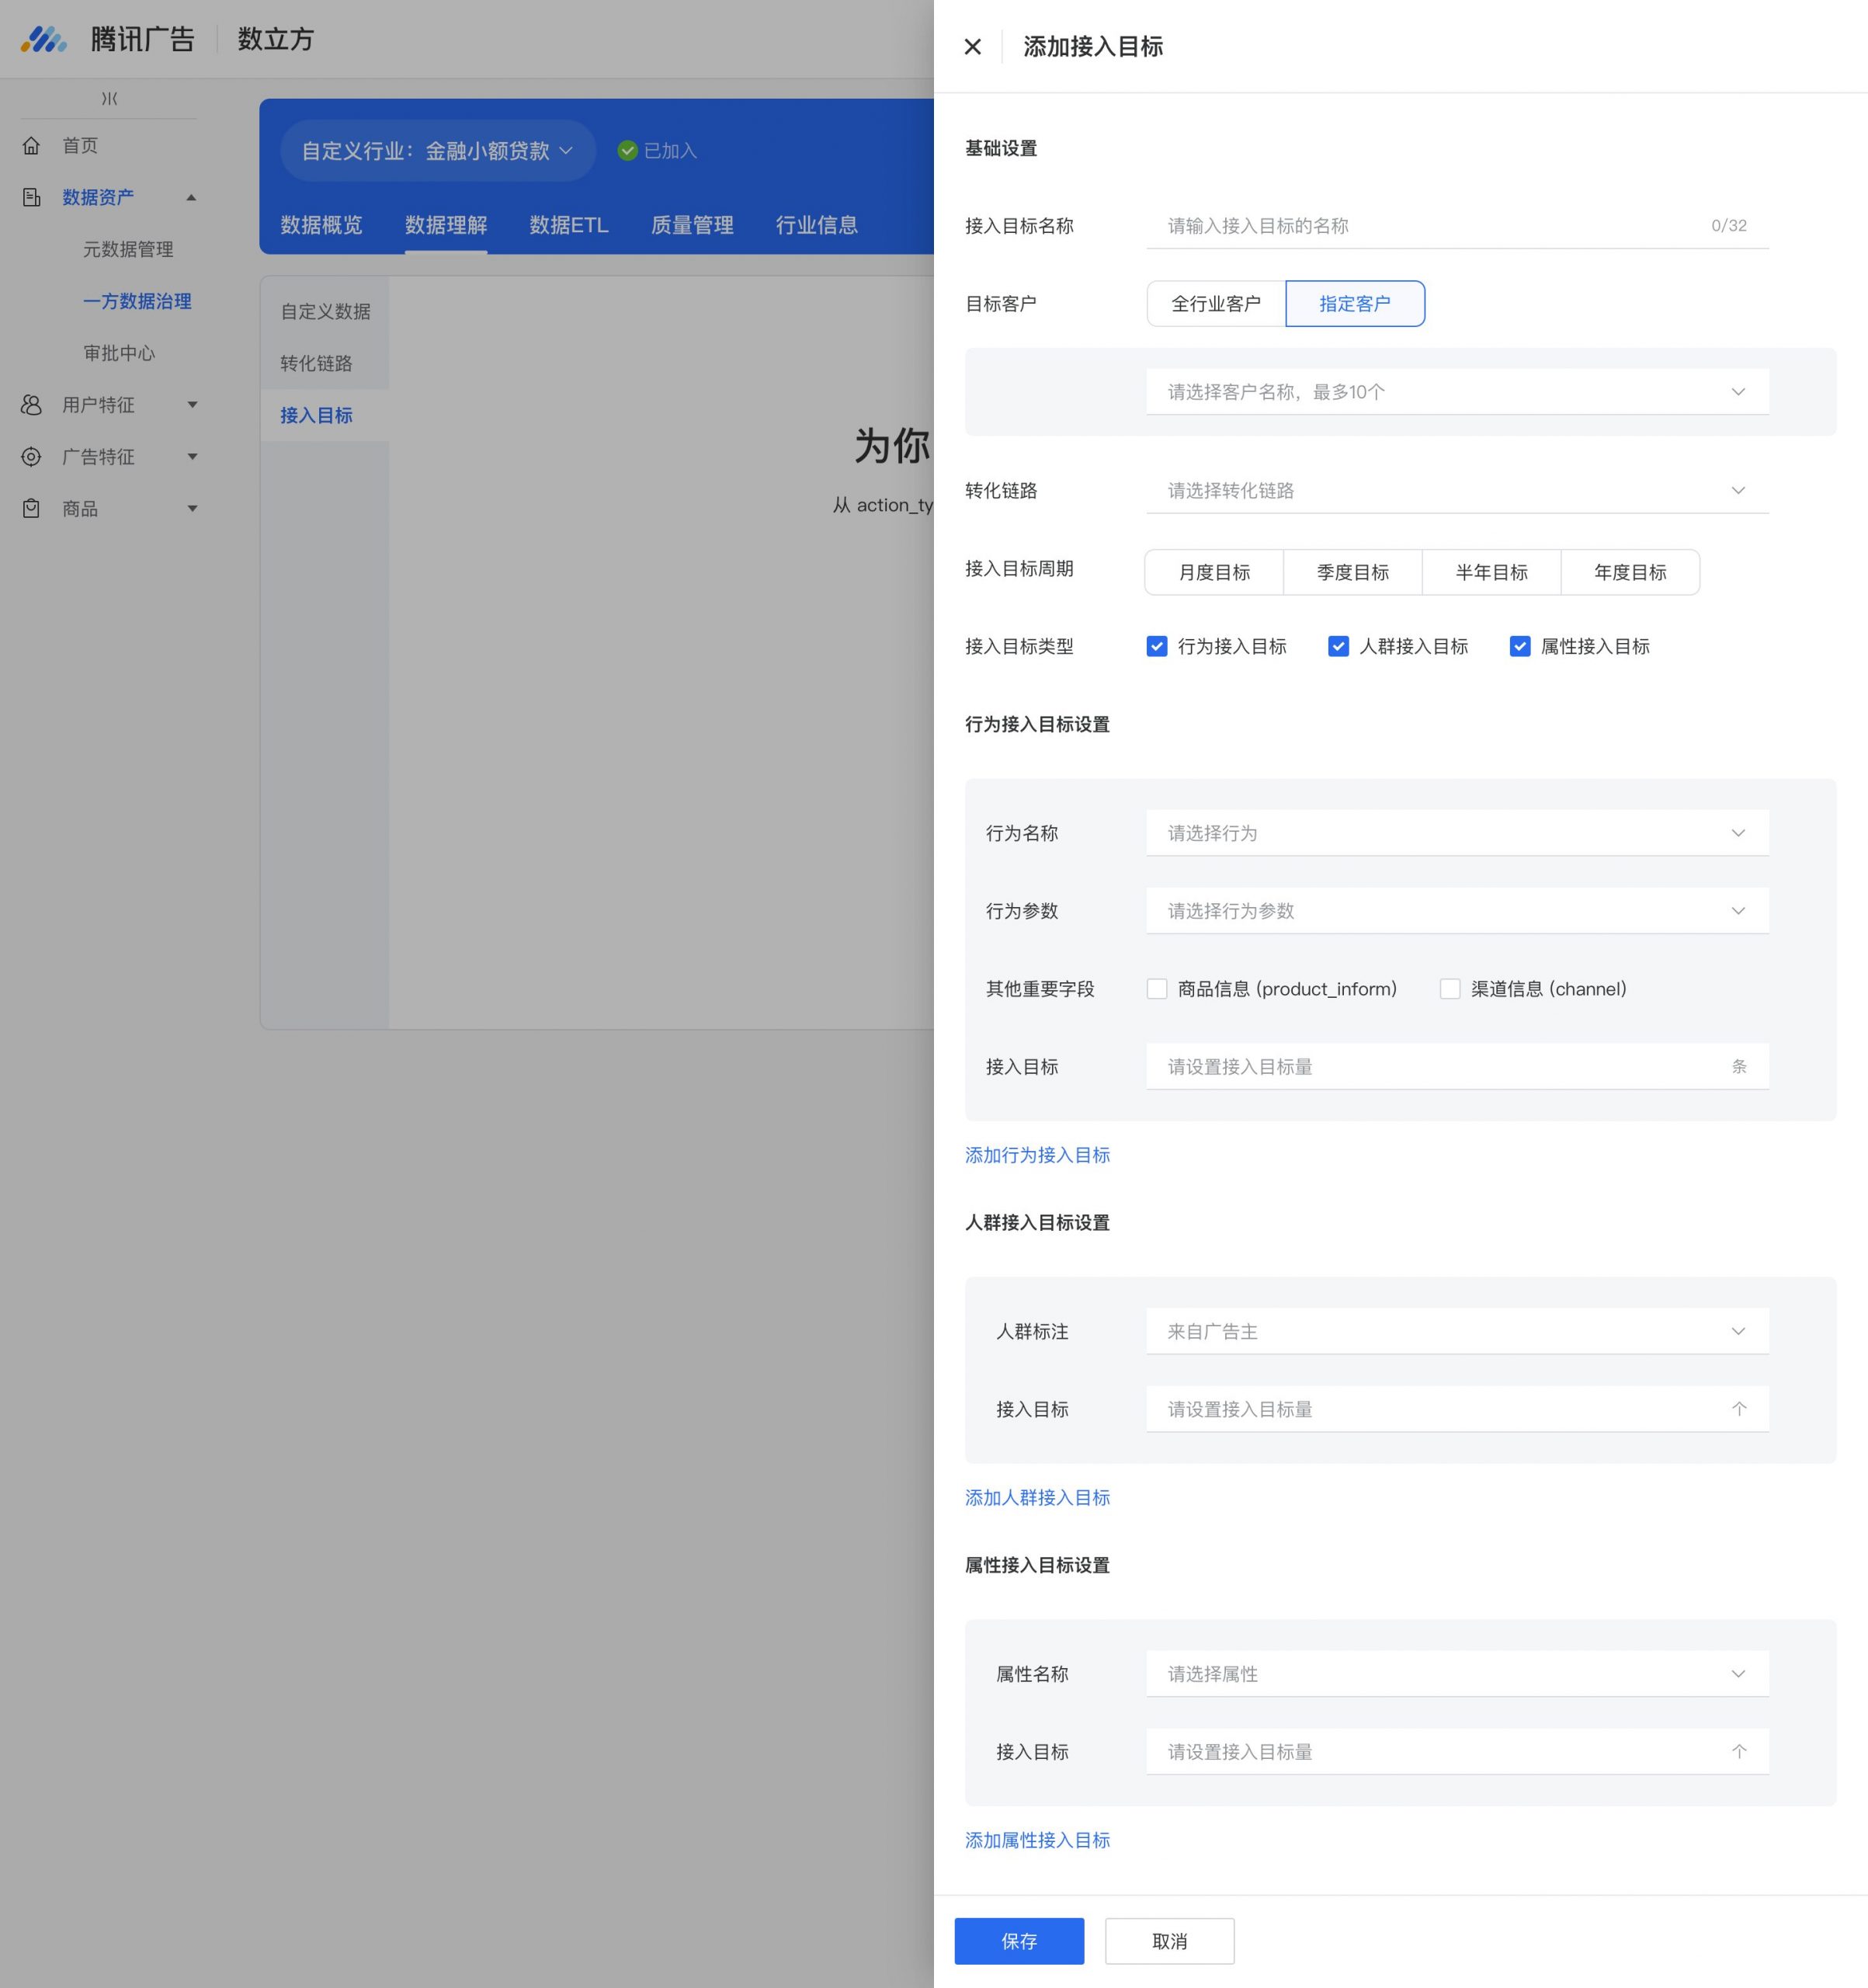
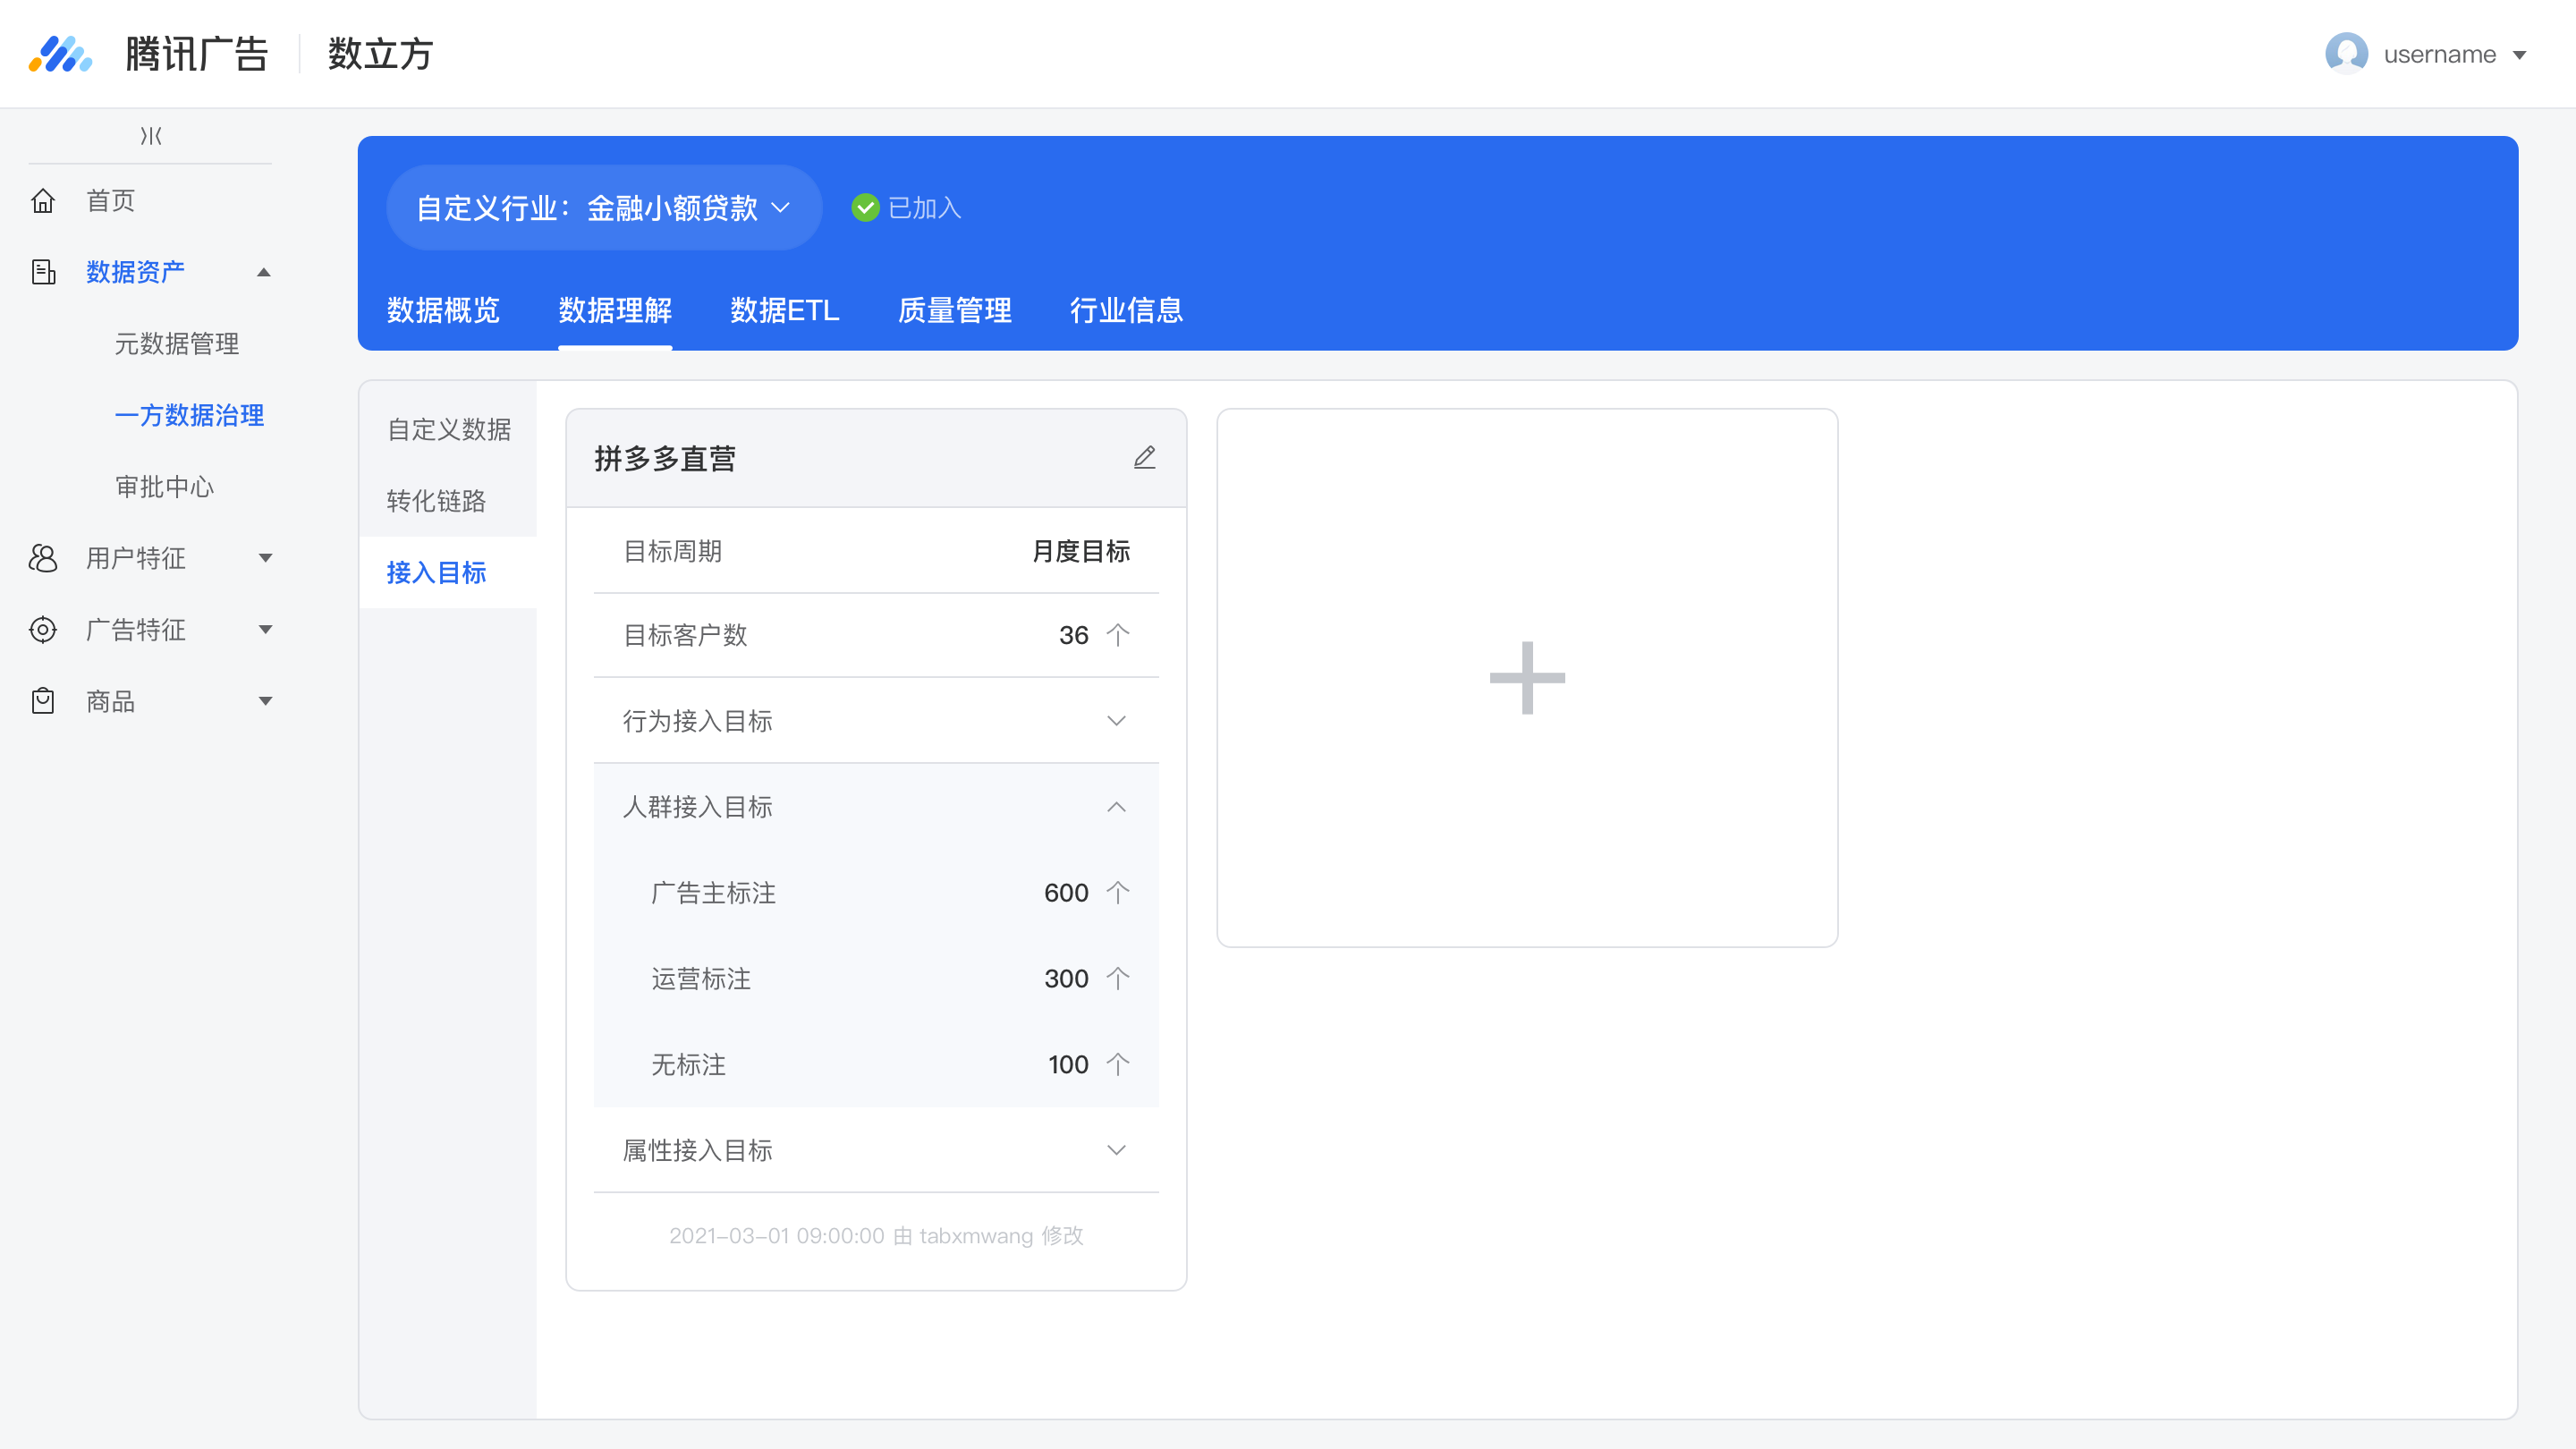
Using a Modal Style
How might we design the data visualization?
Problem
It's important to have a clear understanding of the data's current state, available support, and general characteristics before designing anything. However, sometimes we may need to proceed without any data context. In such cases, we can rely on the data's meaning, such as the number of data sources, the volume of data ingestion, and the data ingestion volume of each node on the conversion path. We also need to know the target volume of data ingestion achieved. Using some statistical measures, we can aggregate this information over time and analyze it to support customer segmentation.
Design Objective
- Clear structure.
- Accurate information.
Design Strategy
- Set fixed areas for segmentation, filters, dimensions, and metrics. Select relevant graphs for each metric.
Solution
The Achieved Target
- Segmentation: Customers
Filters: Statistical Calibre, Time Granularity, Data Ingestion Volume Target
Dimensions: Customized Action Types, Audience, Action Attributes
Metrics: Data Ingestion Volume, Achieved Target Ratio
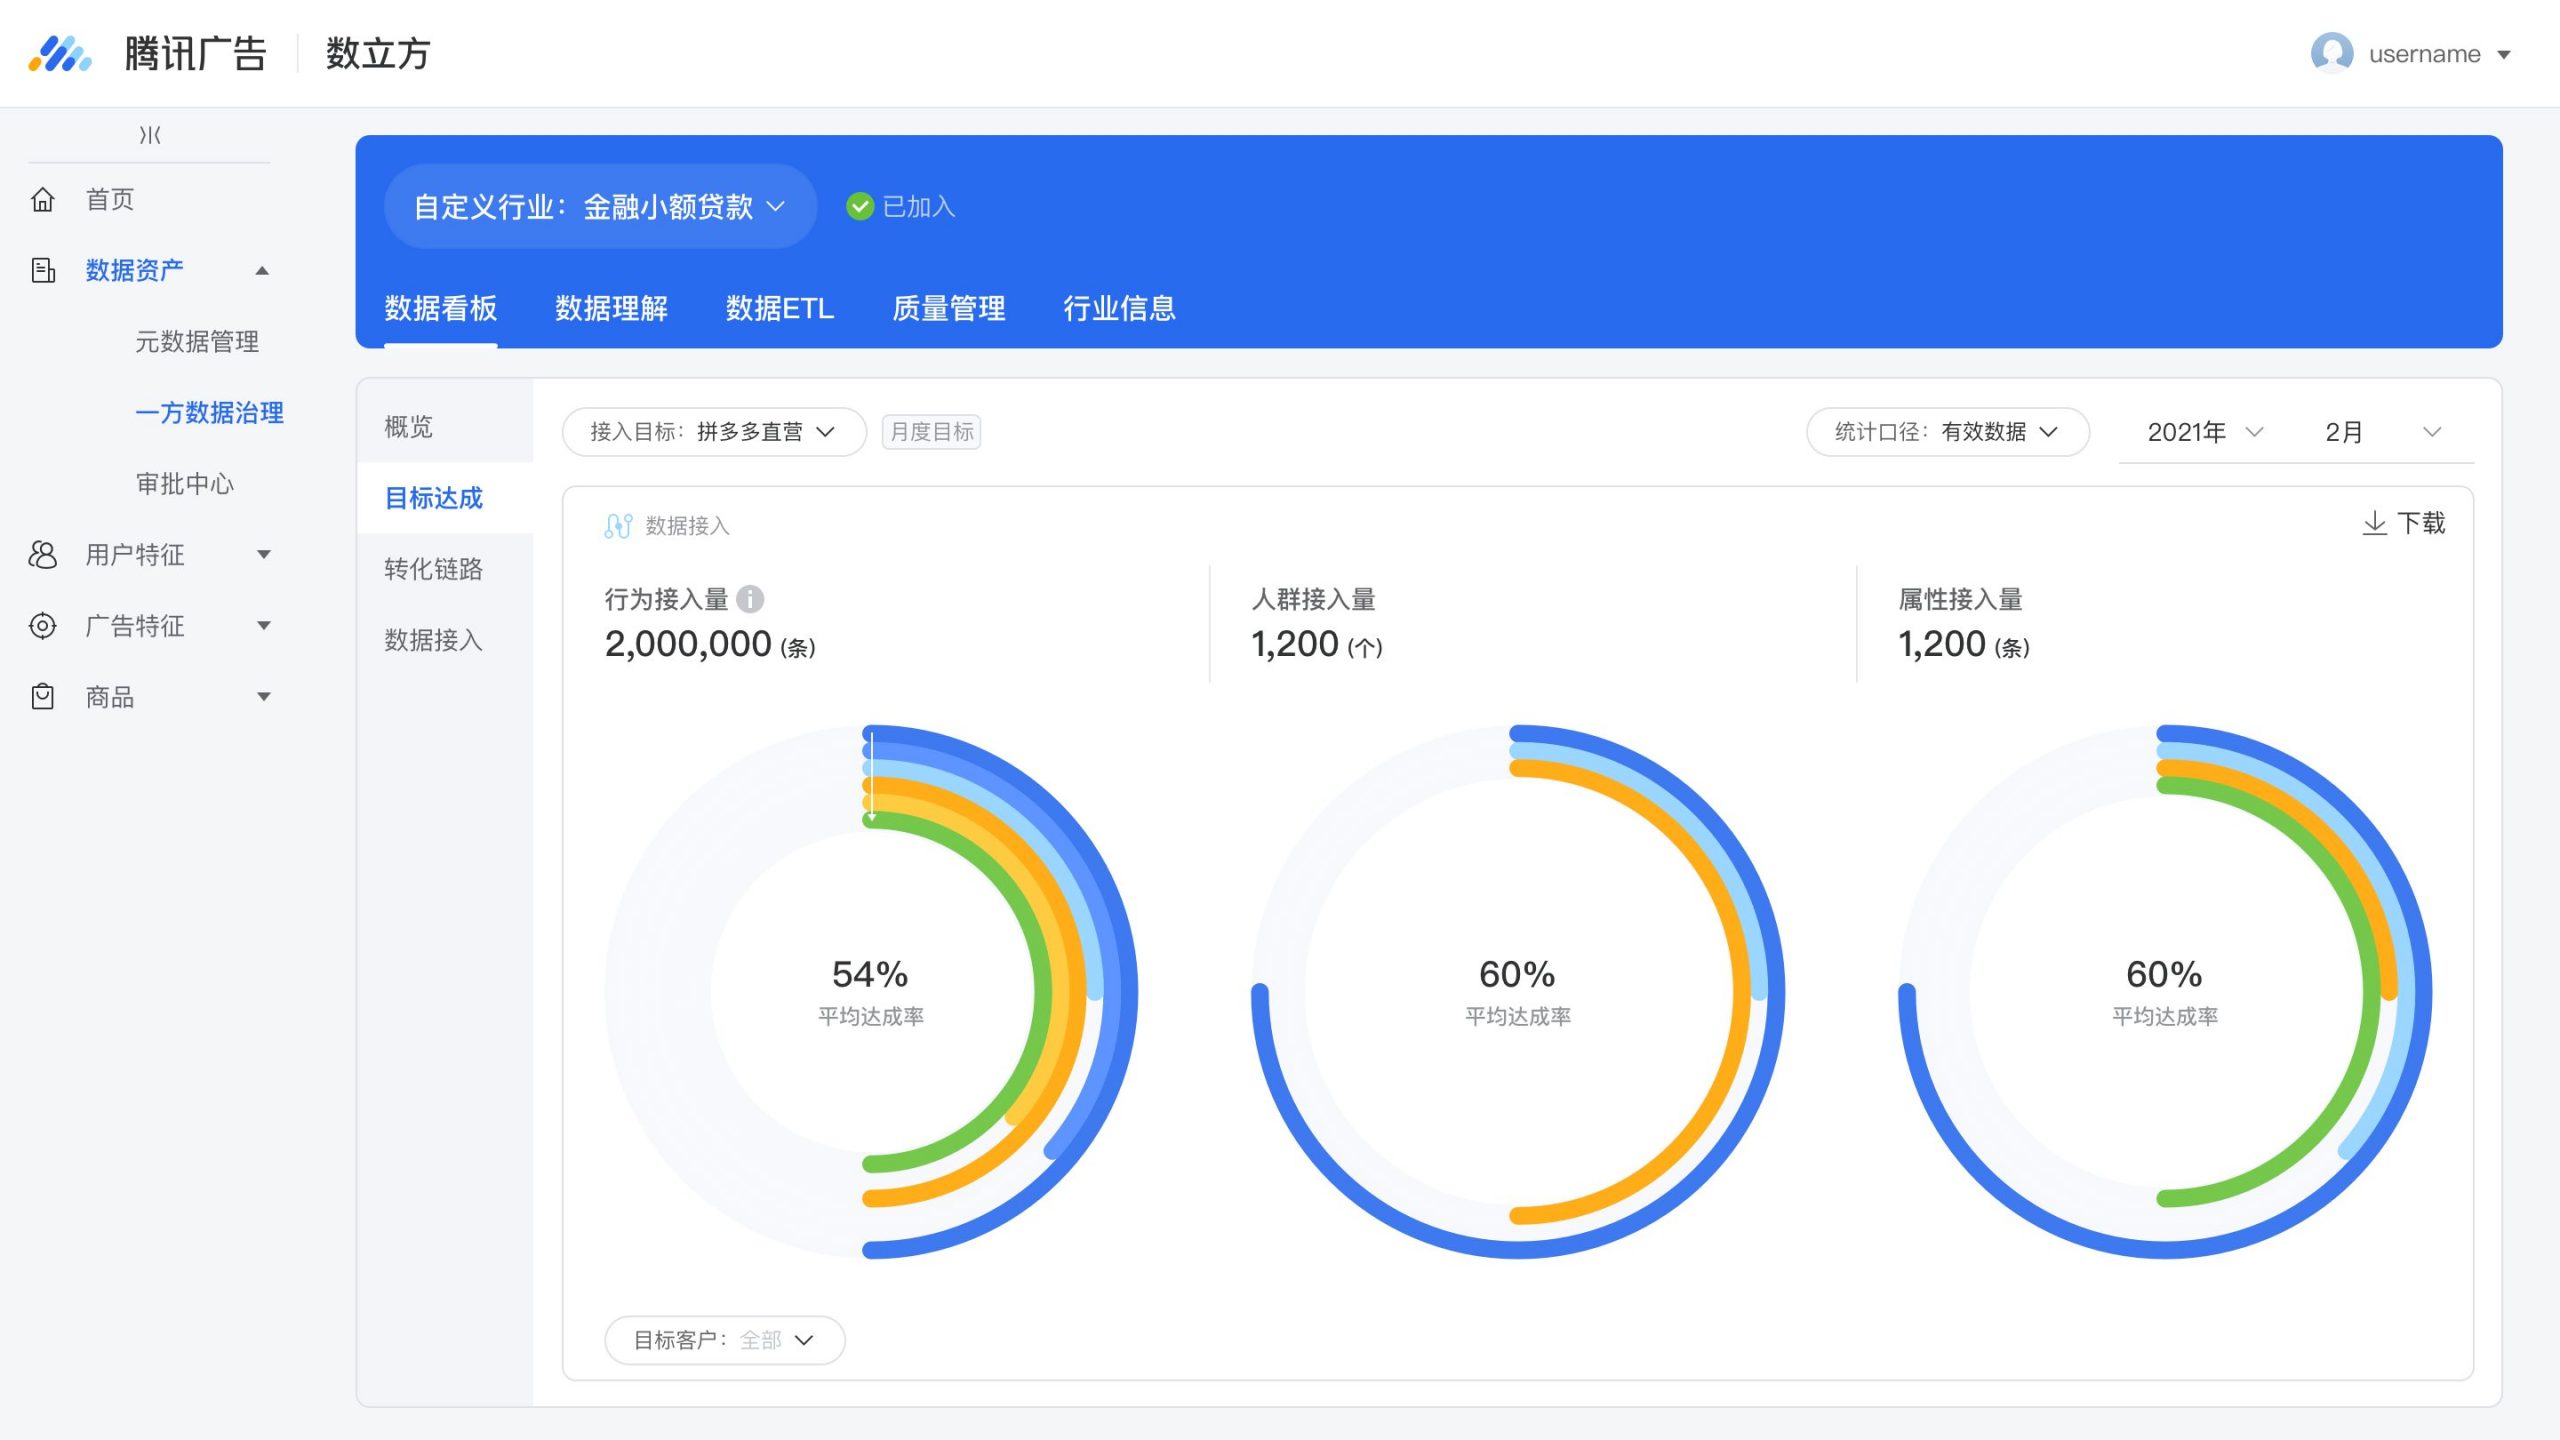
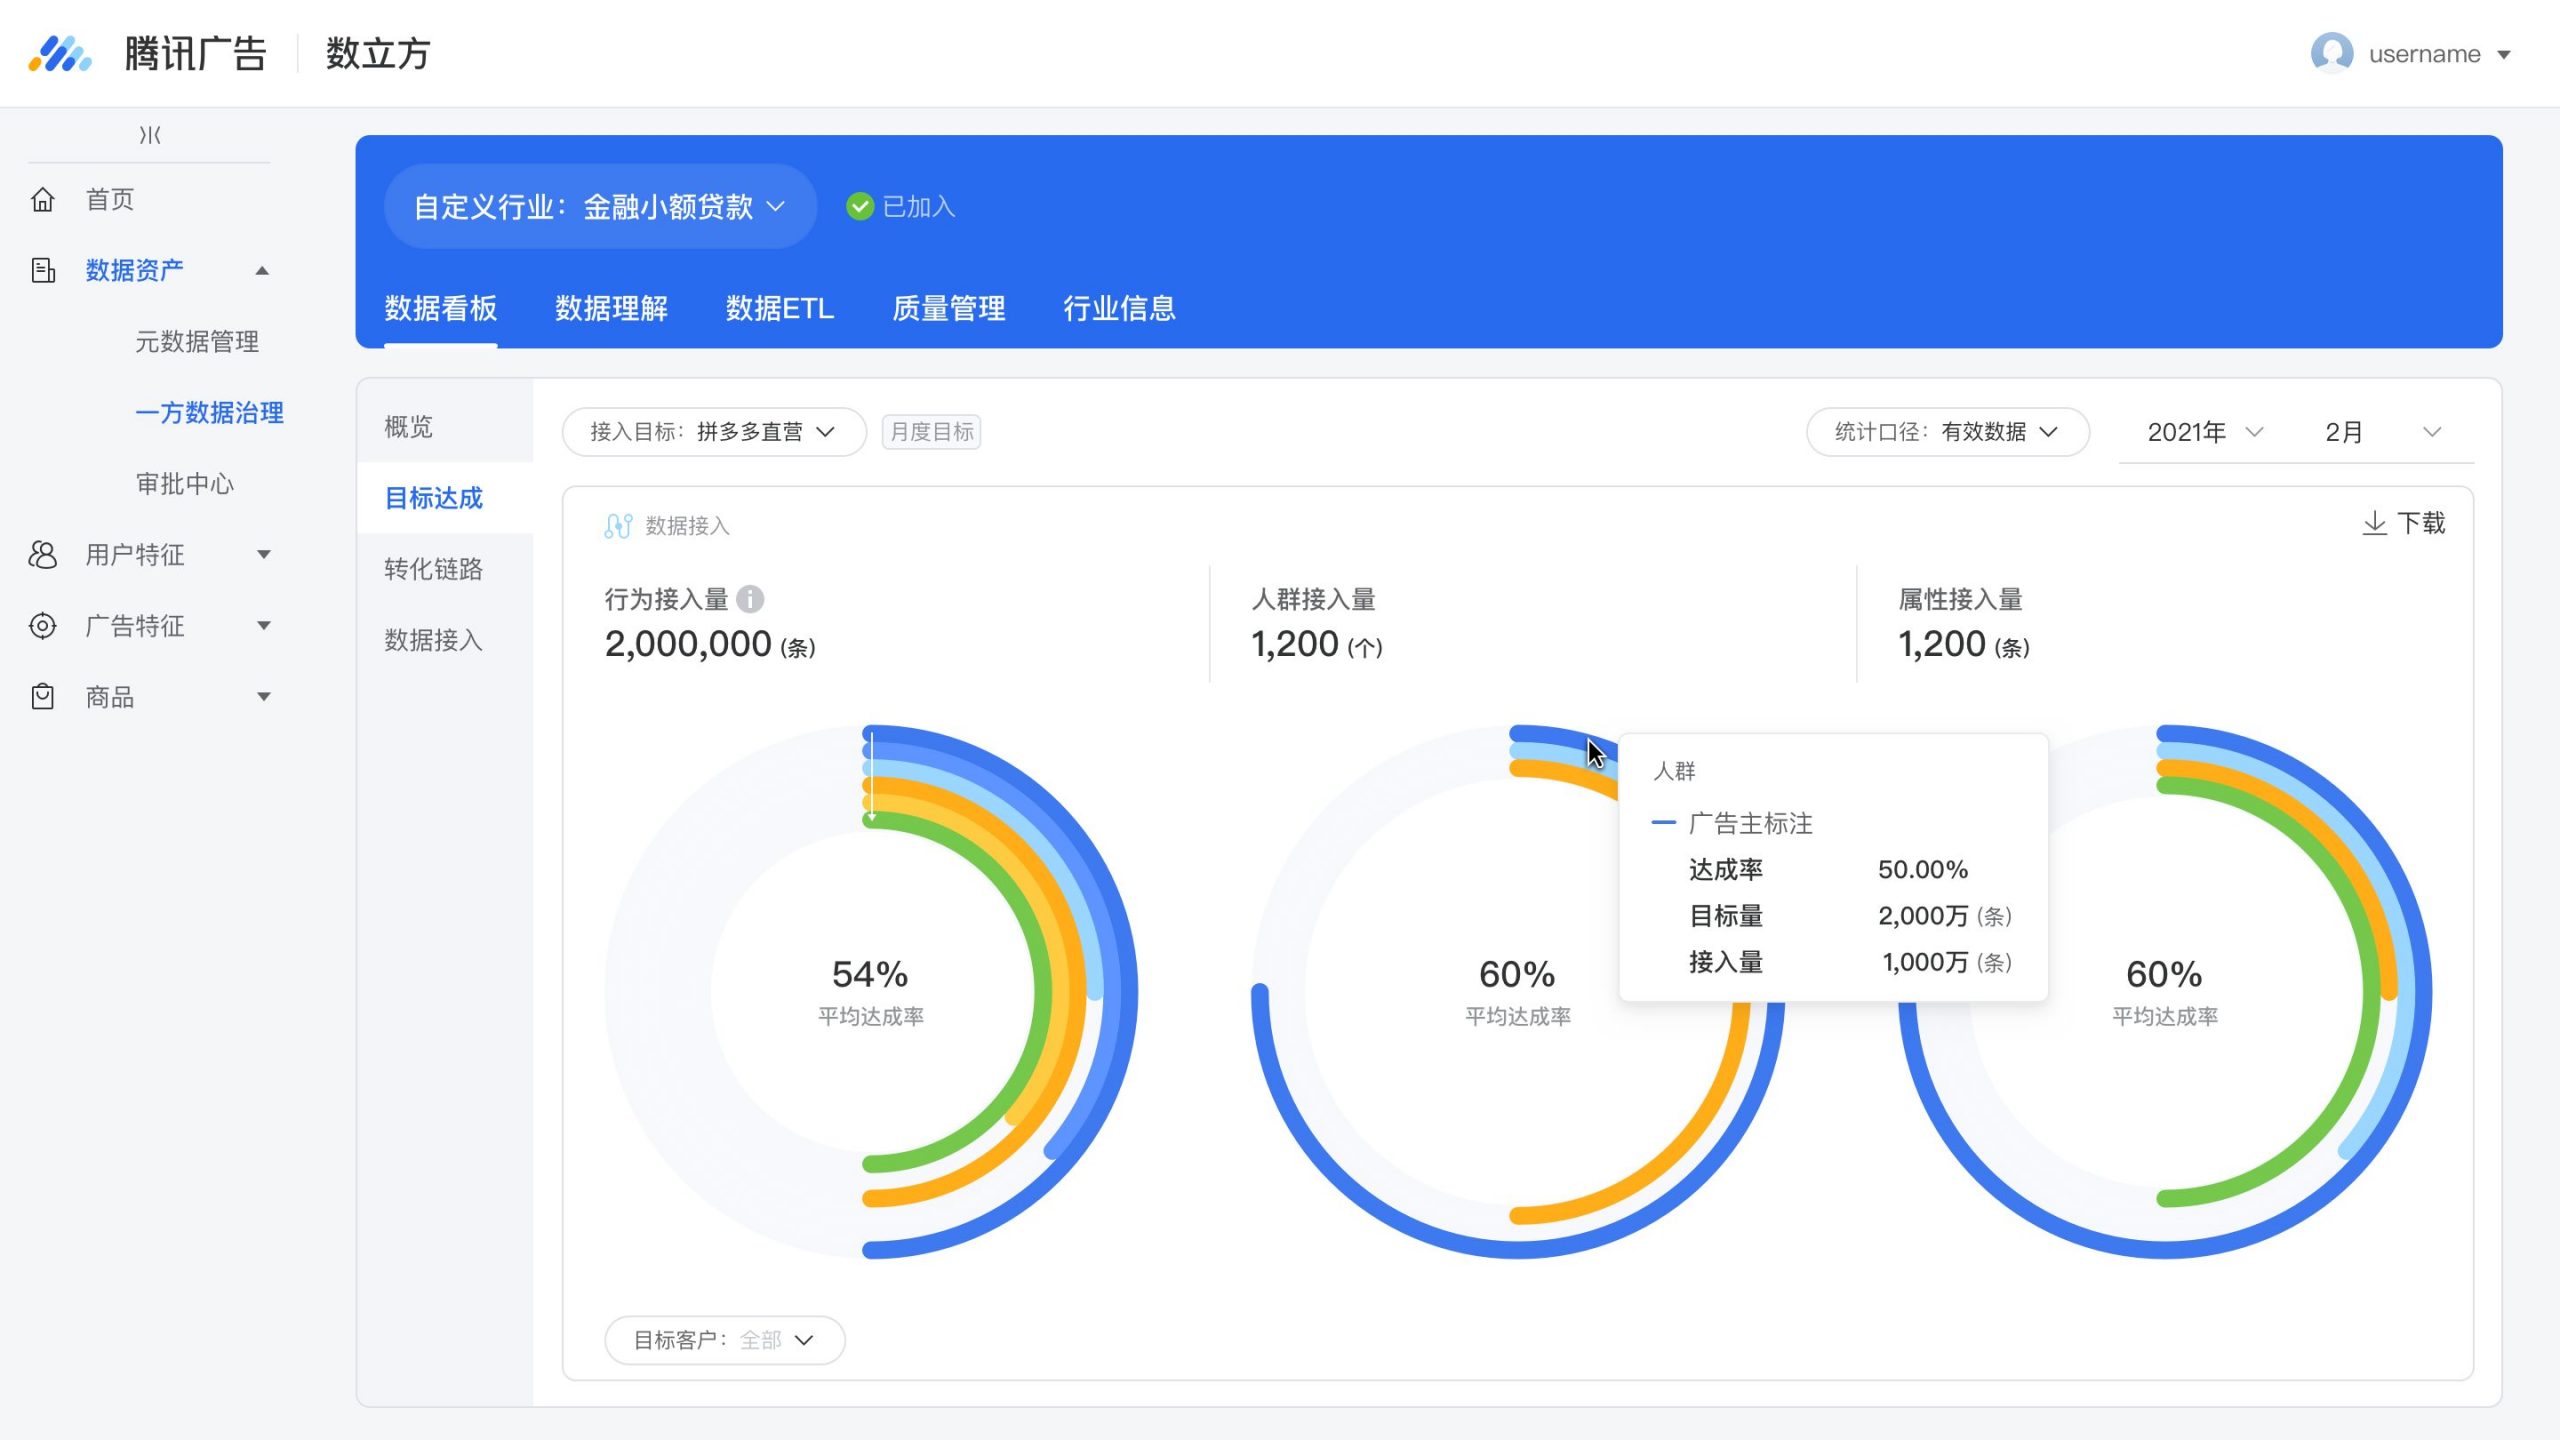
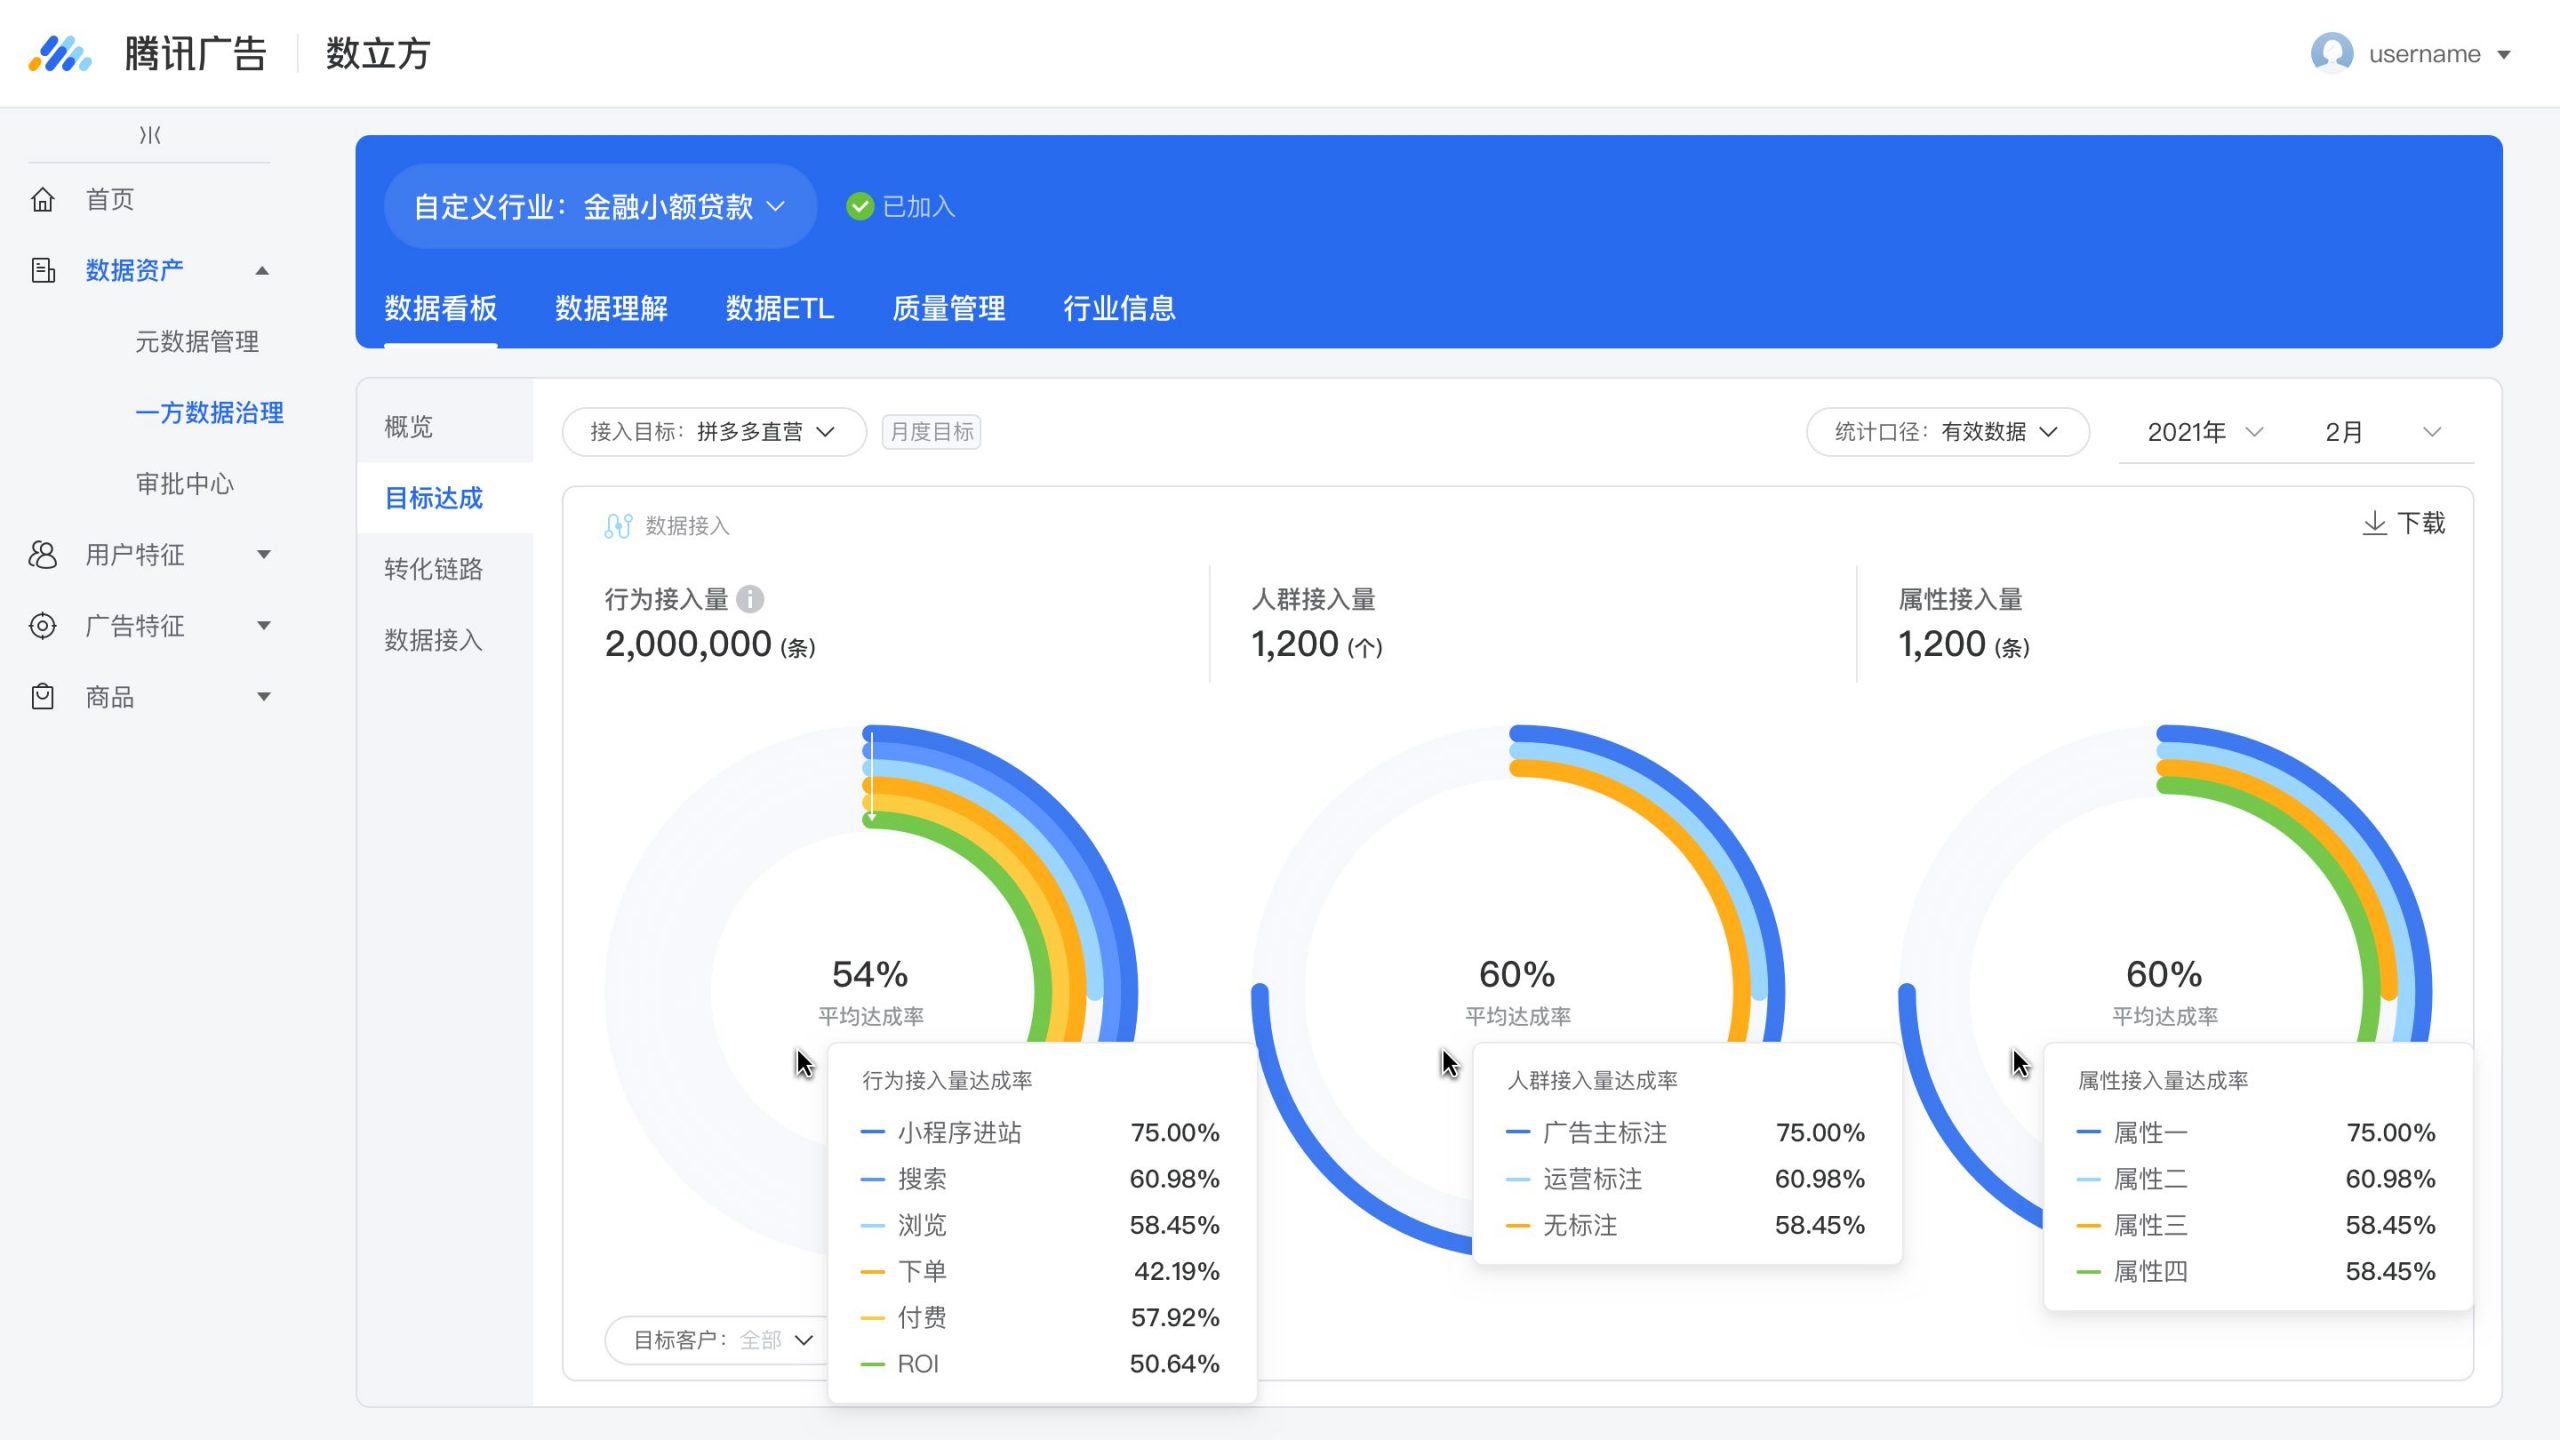
Achieved Goal in a Gauge Ring
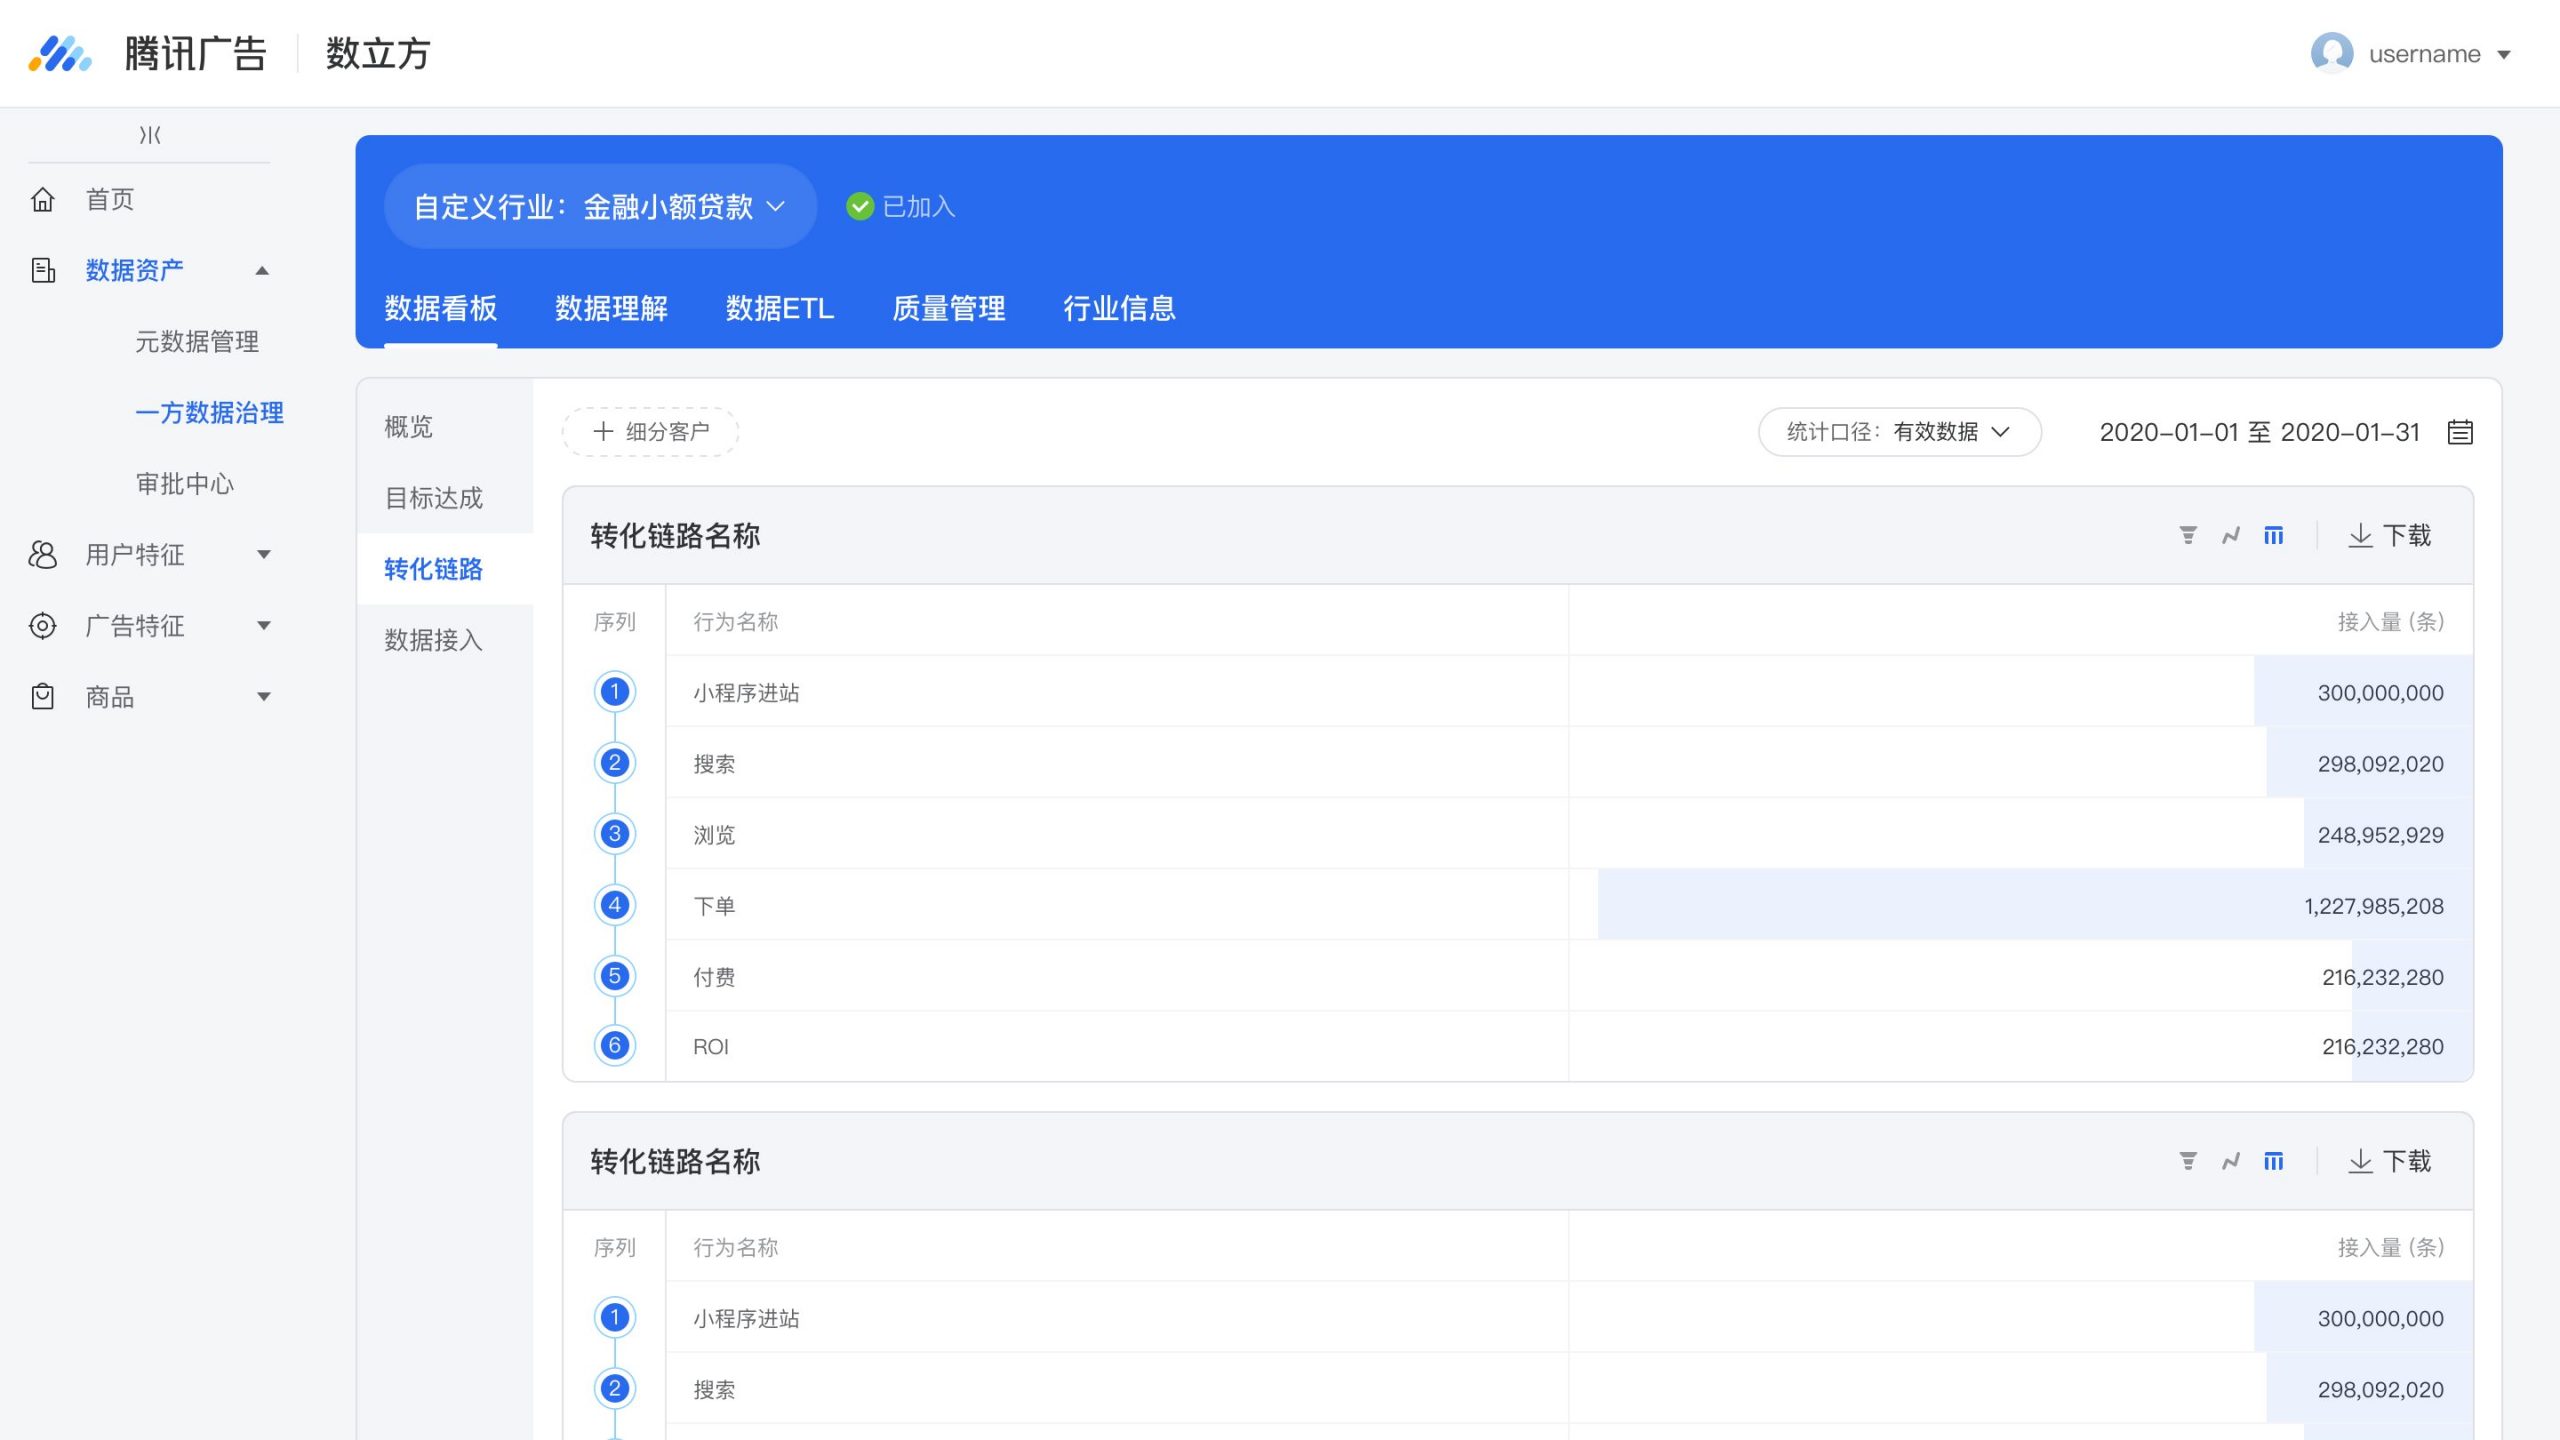
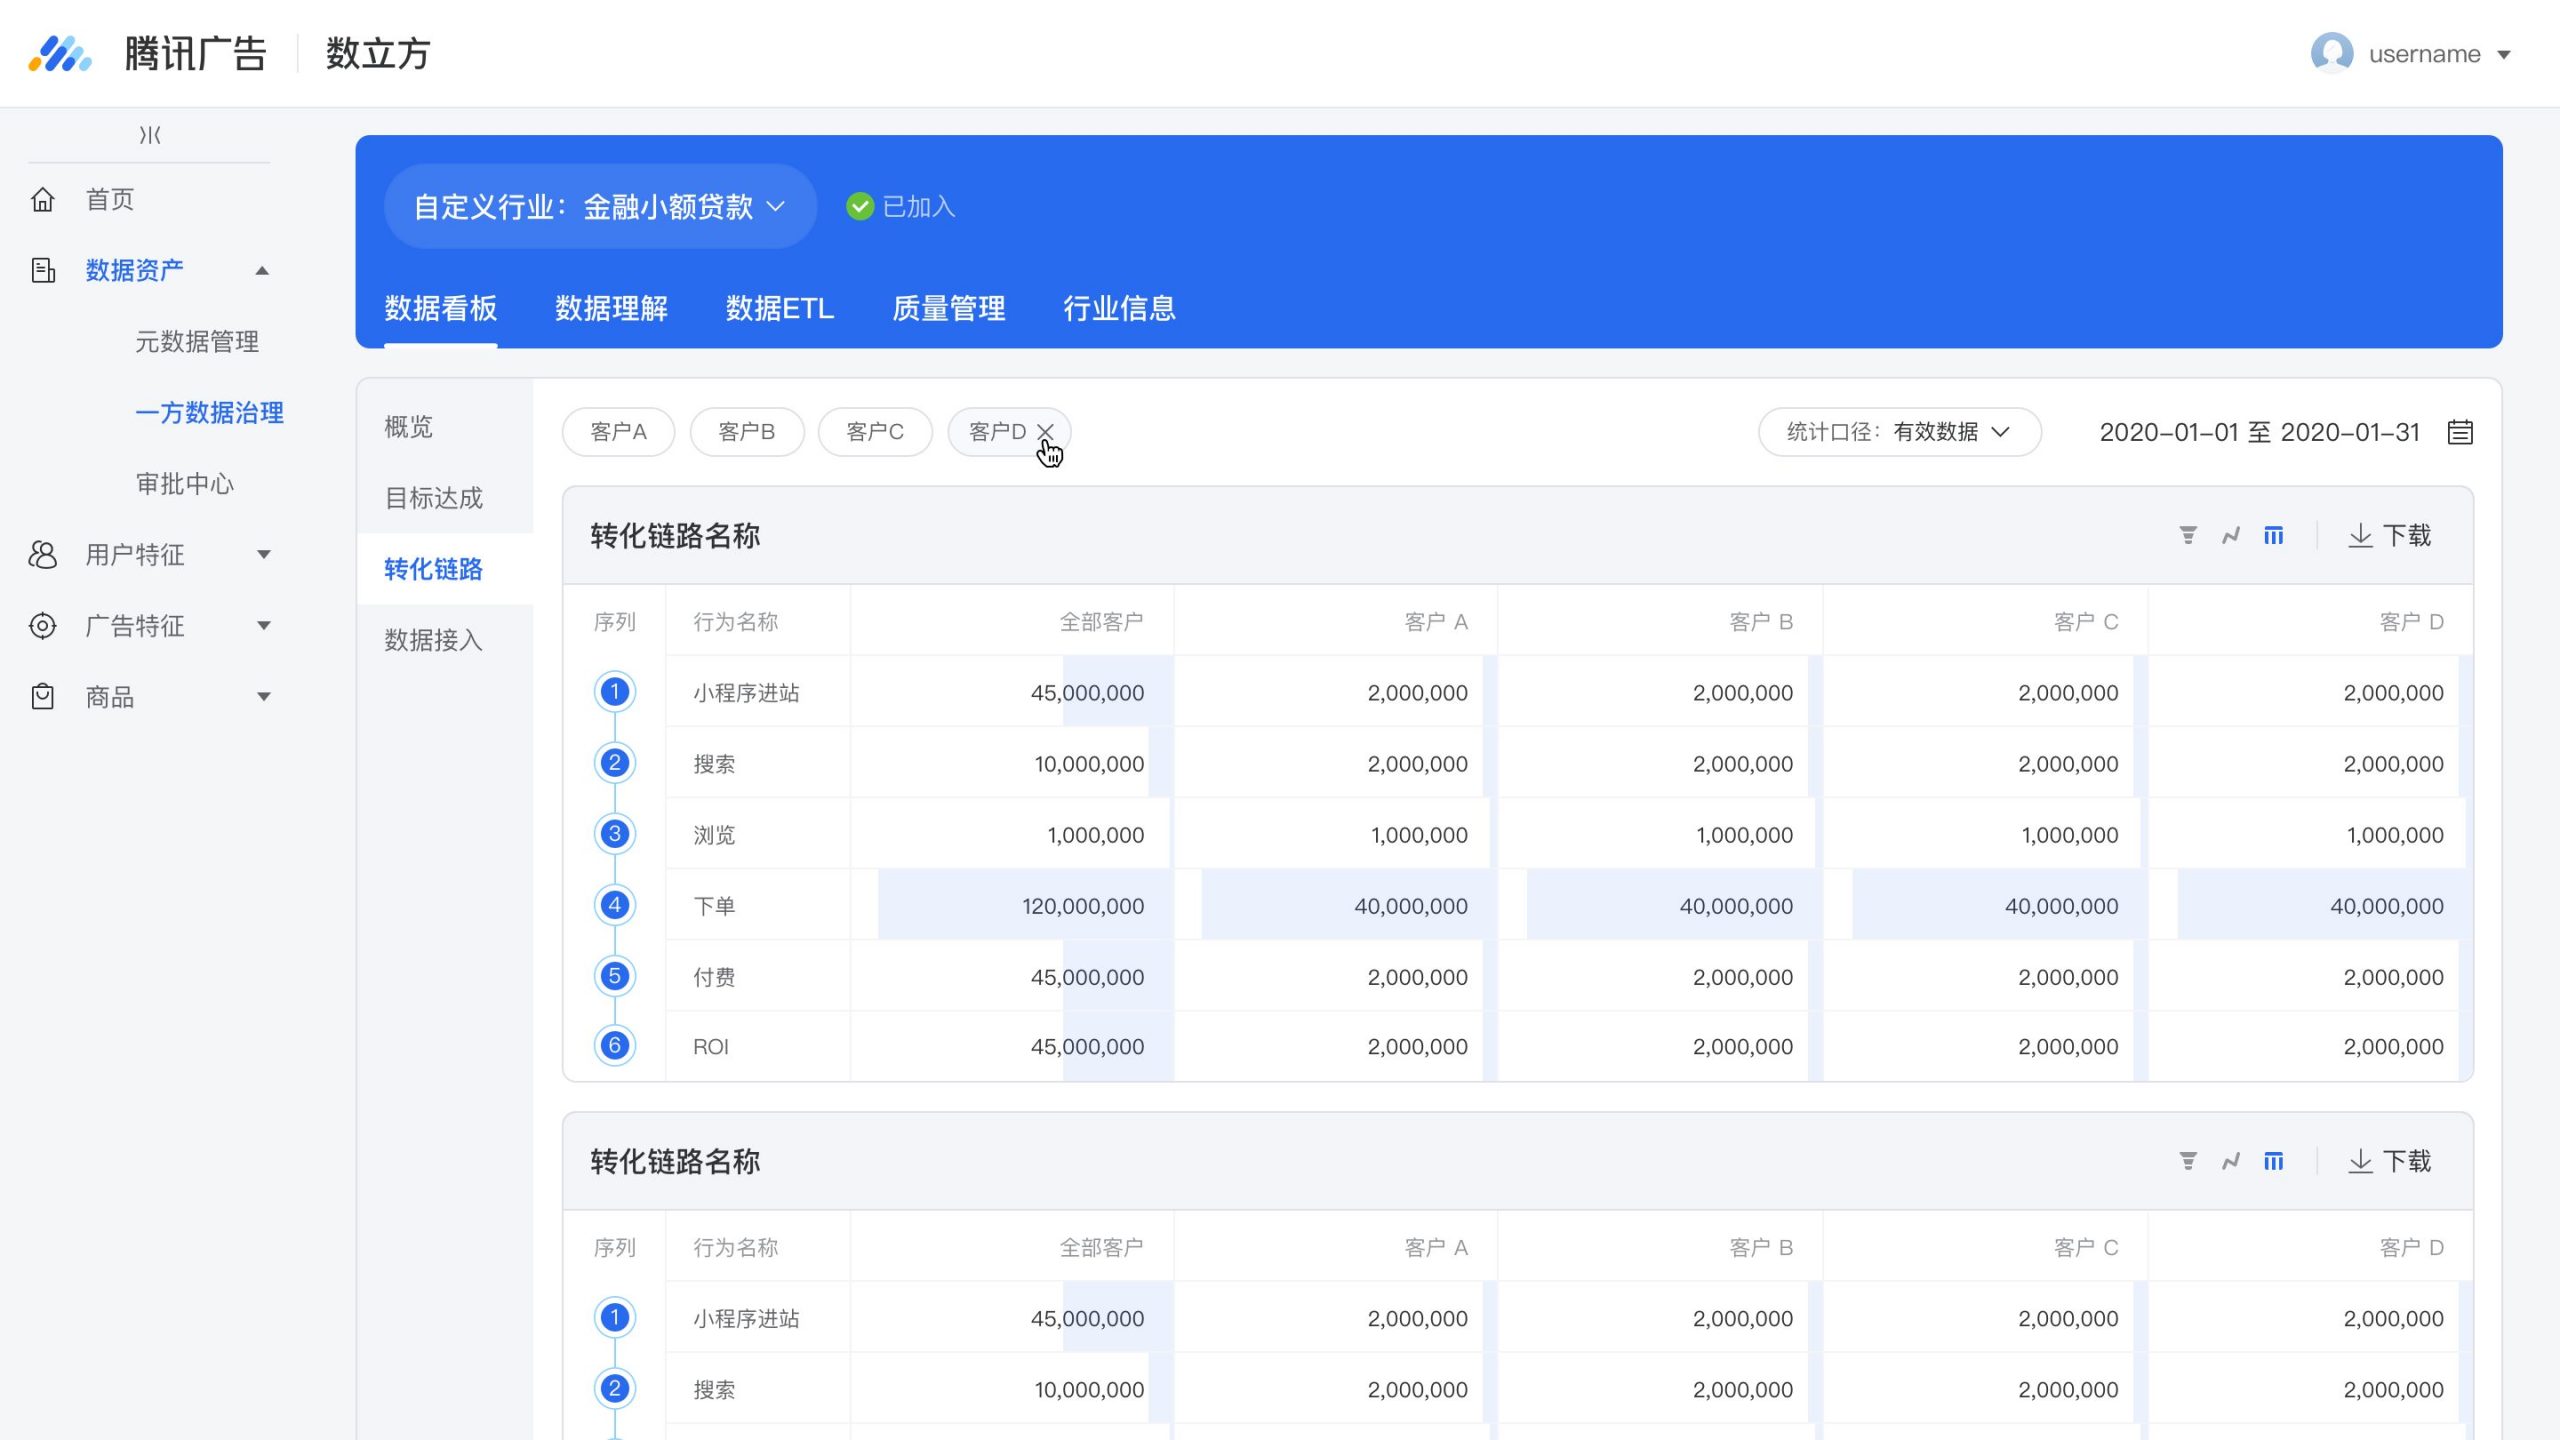
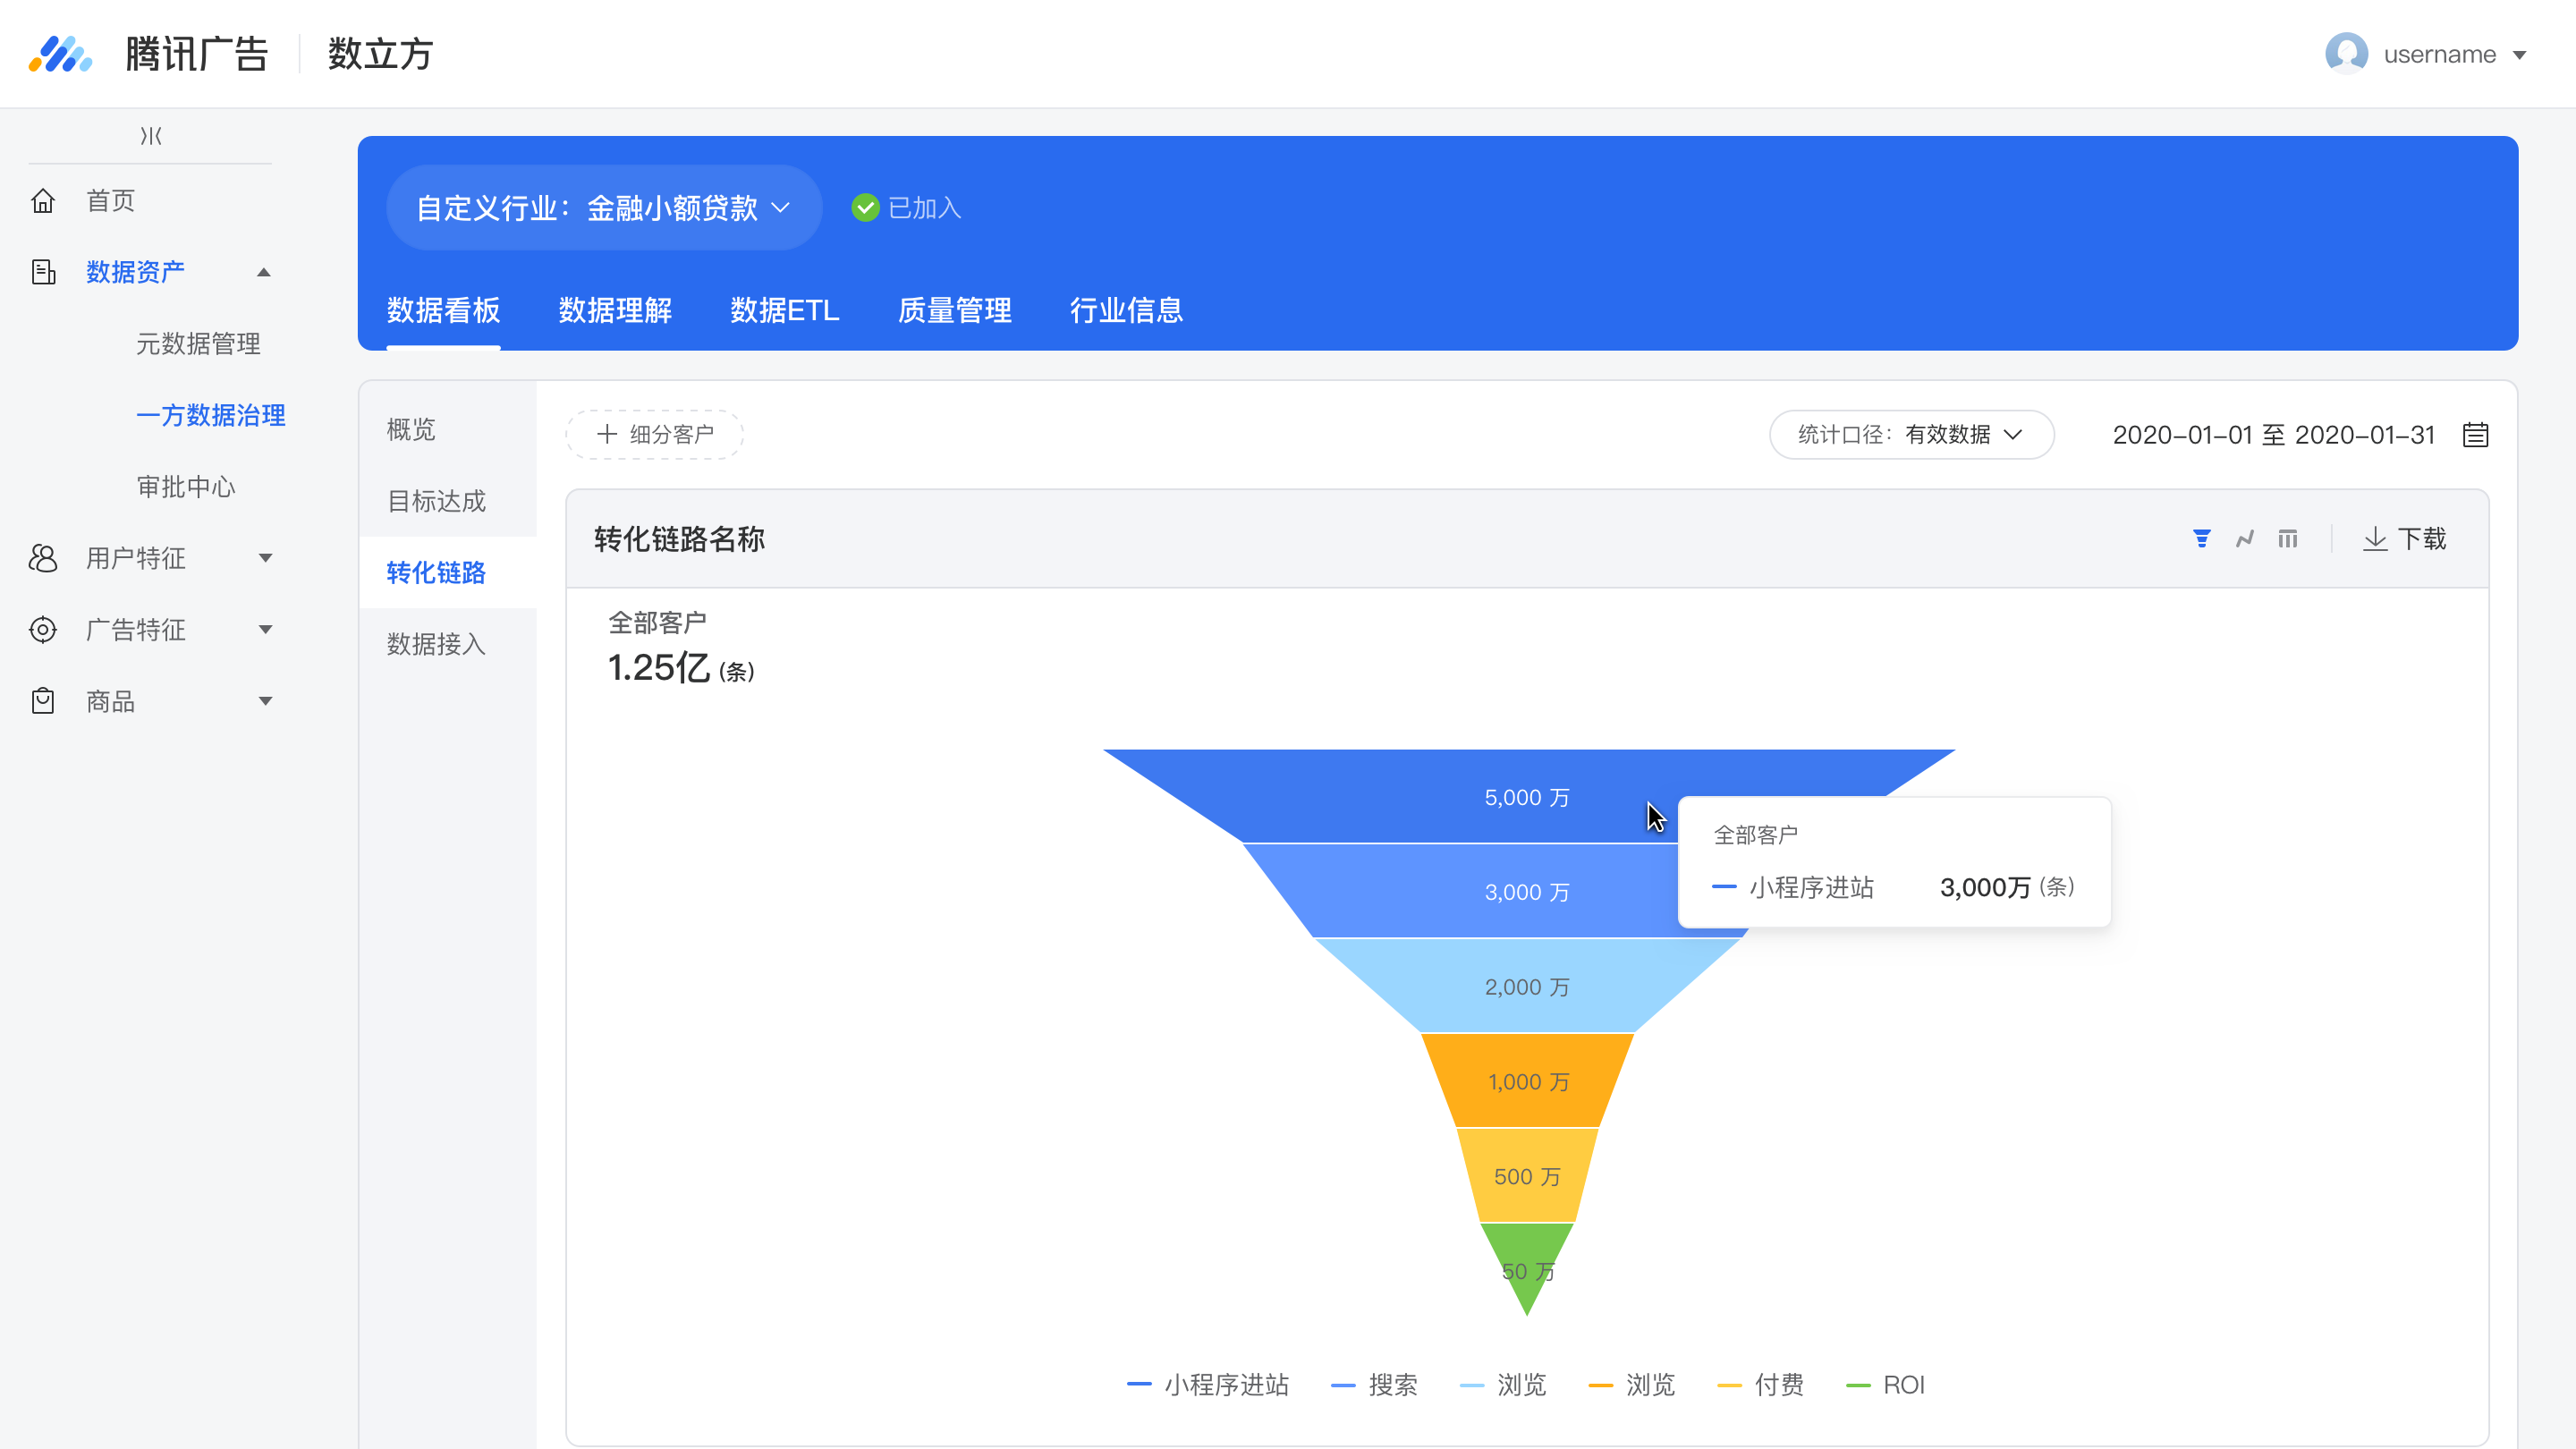
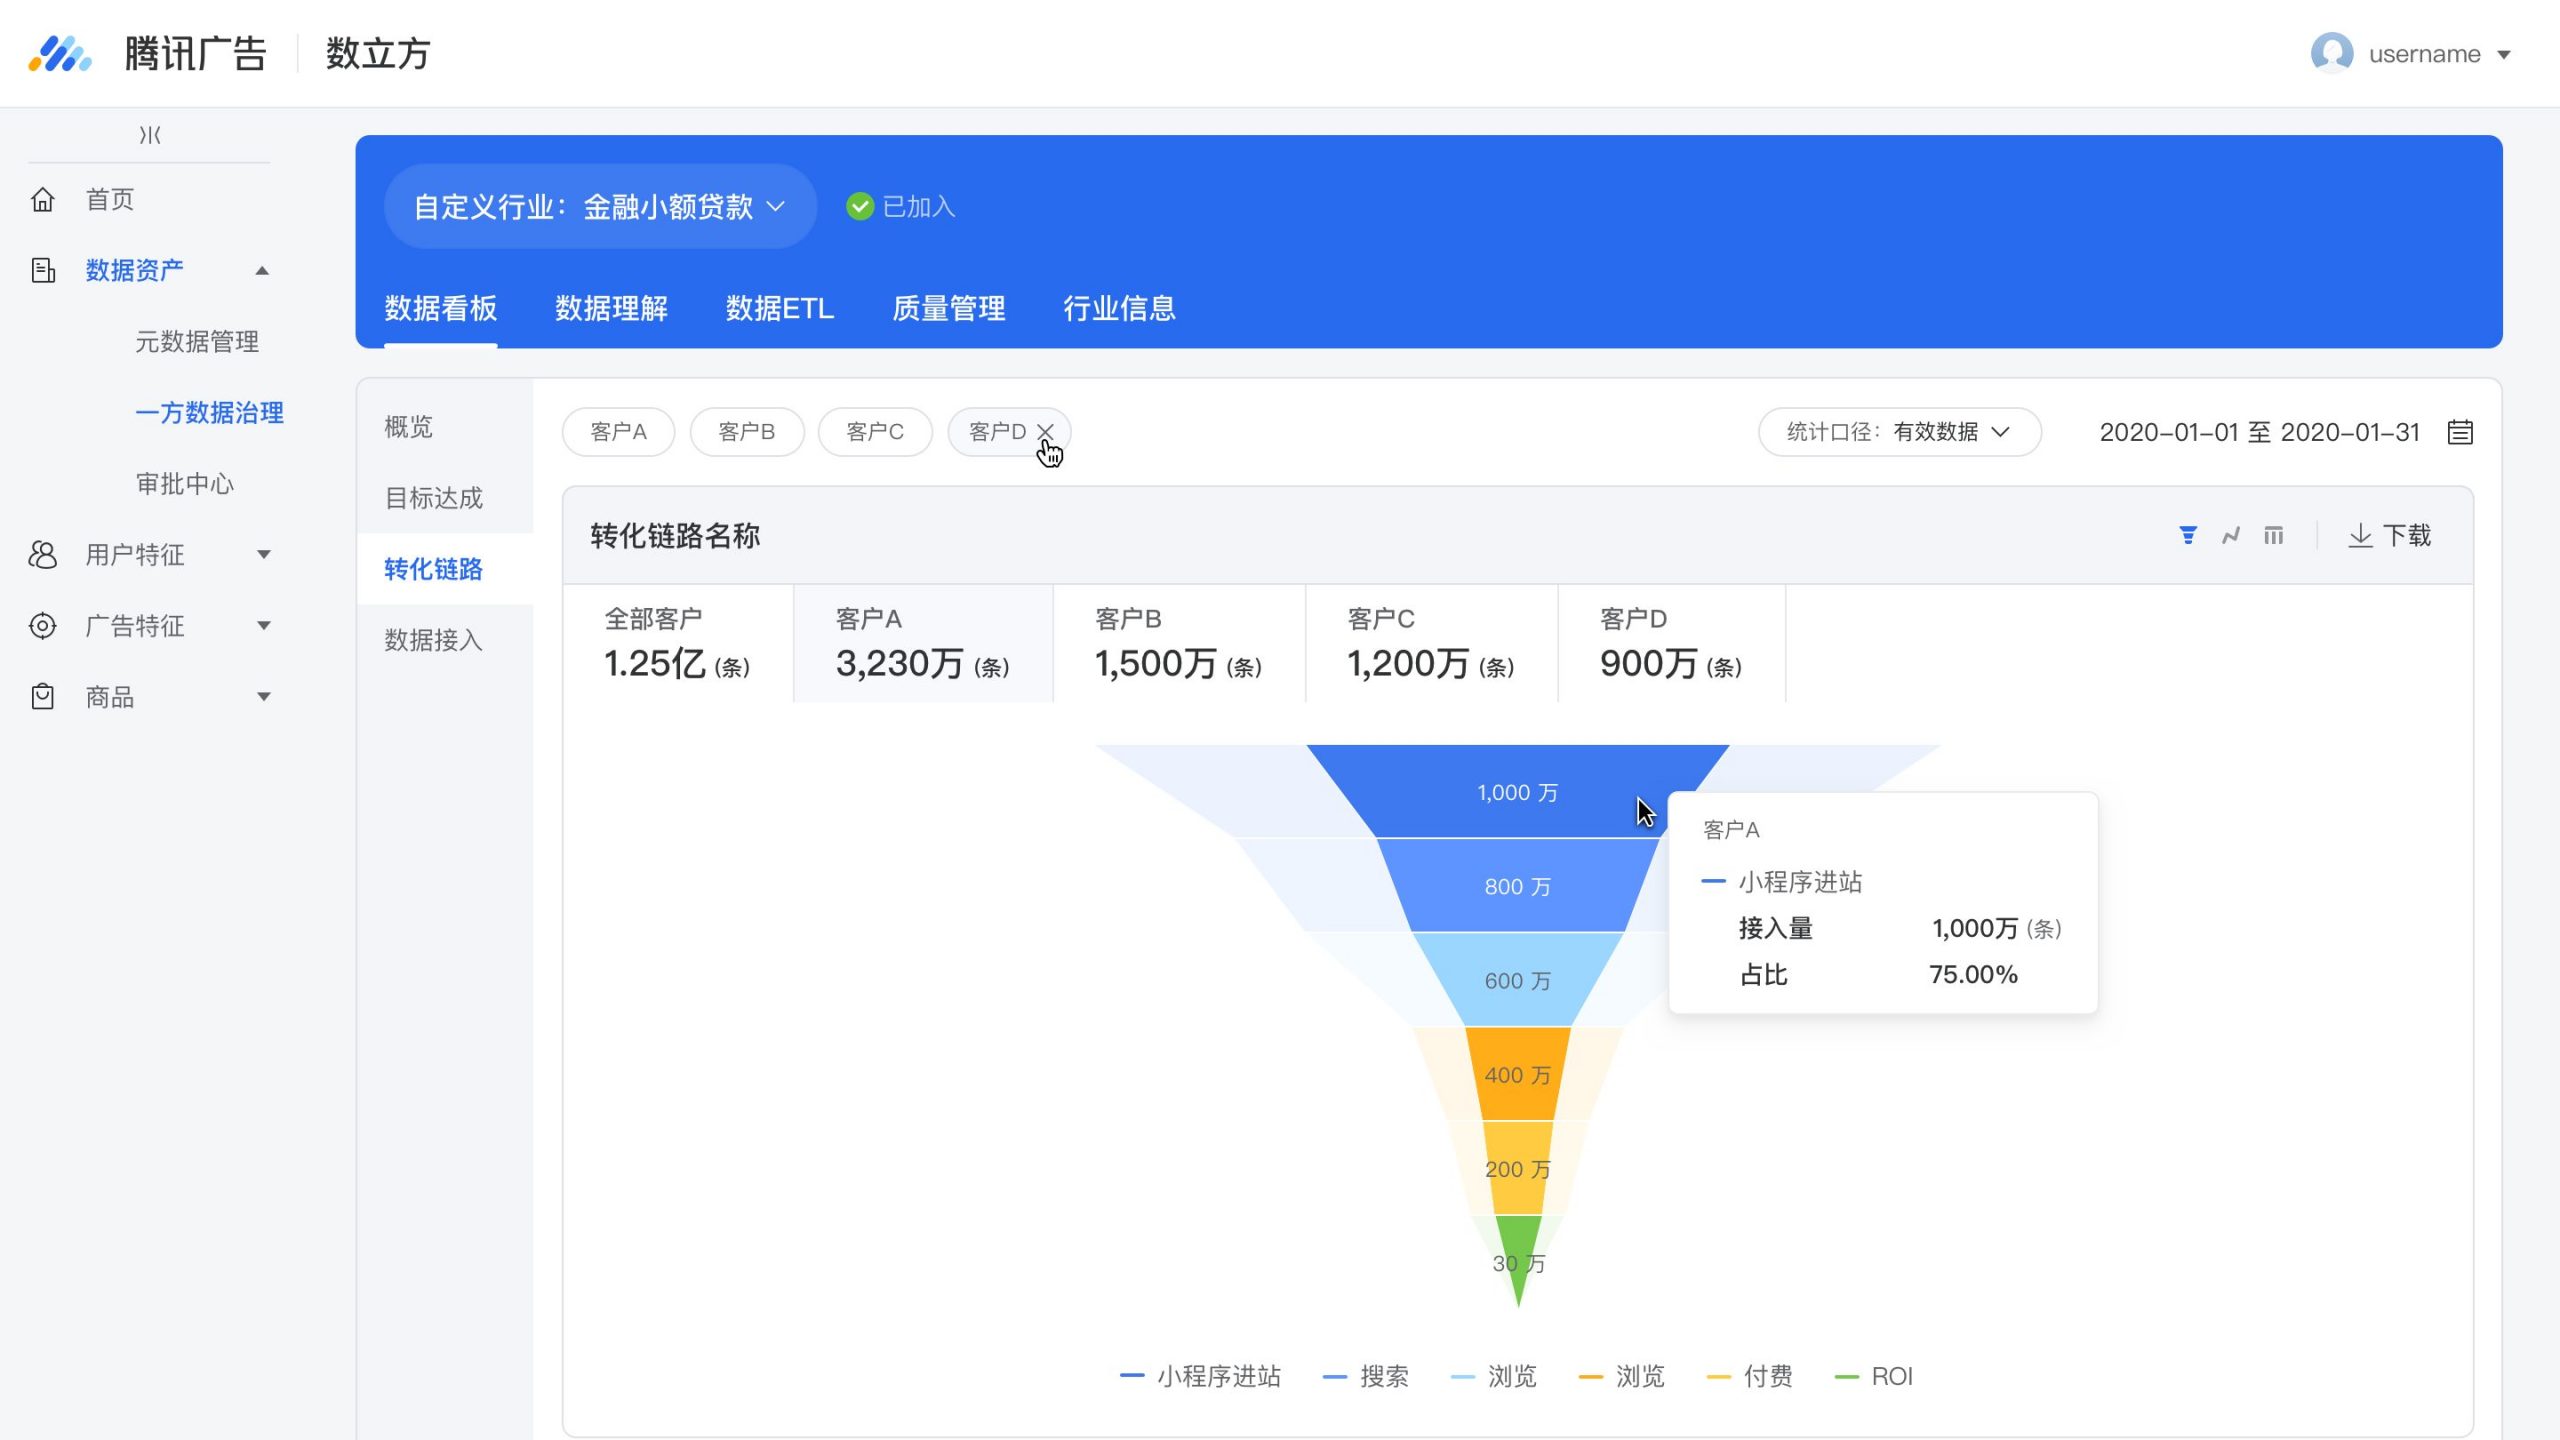
The Conversion Path
- Segmentation: Customers
Filters: Statistical Calibre, Time Granularity
Dimensions: Actions in the Conversion Path
Metrics: Data Ingestion Volume
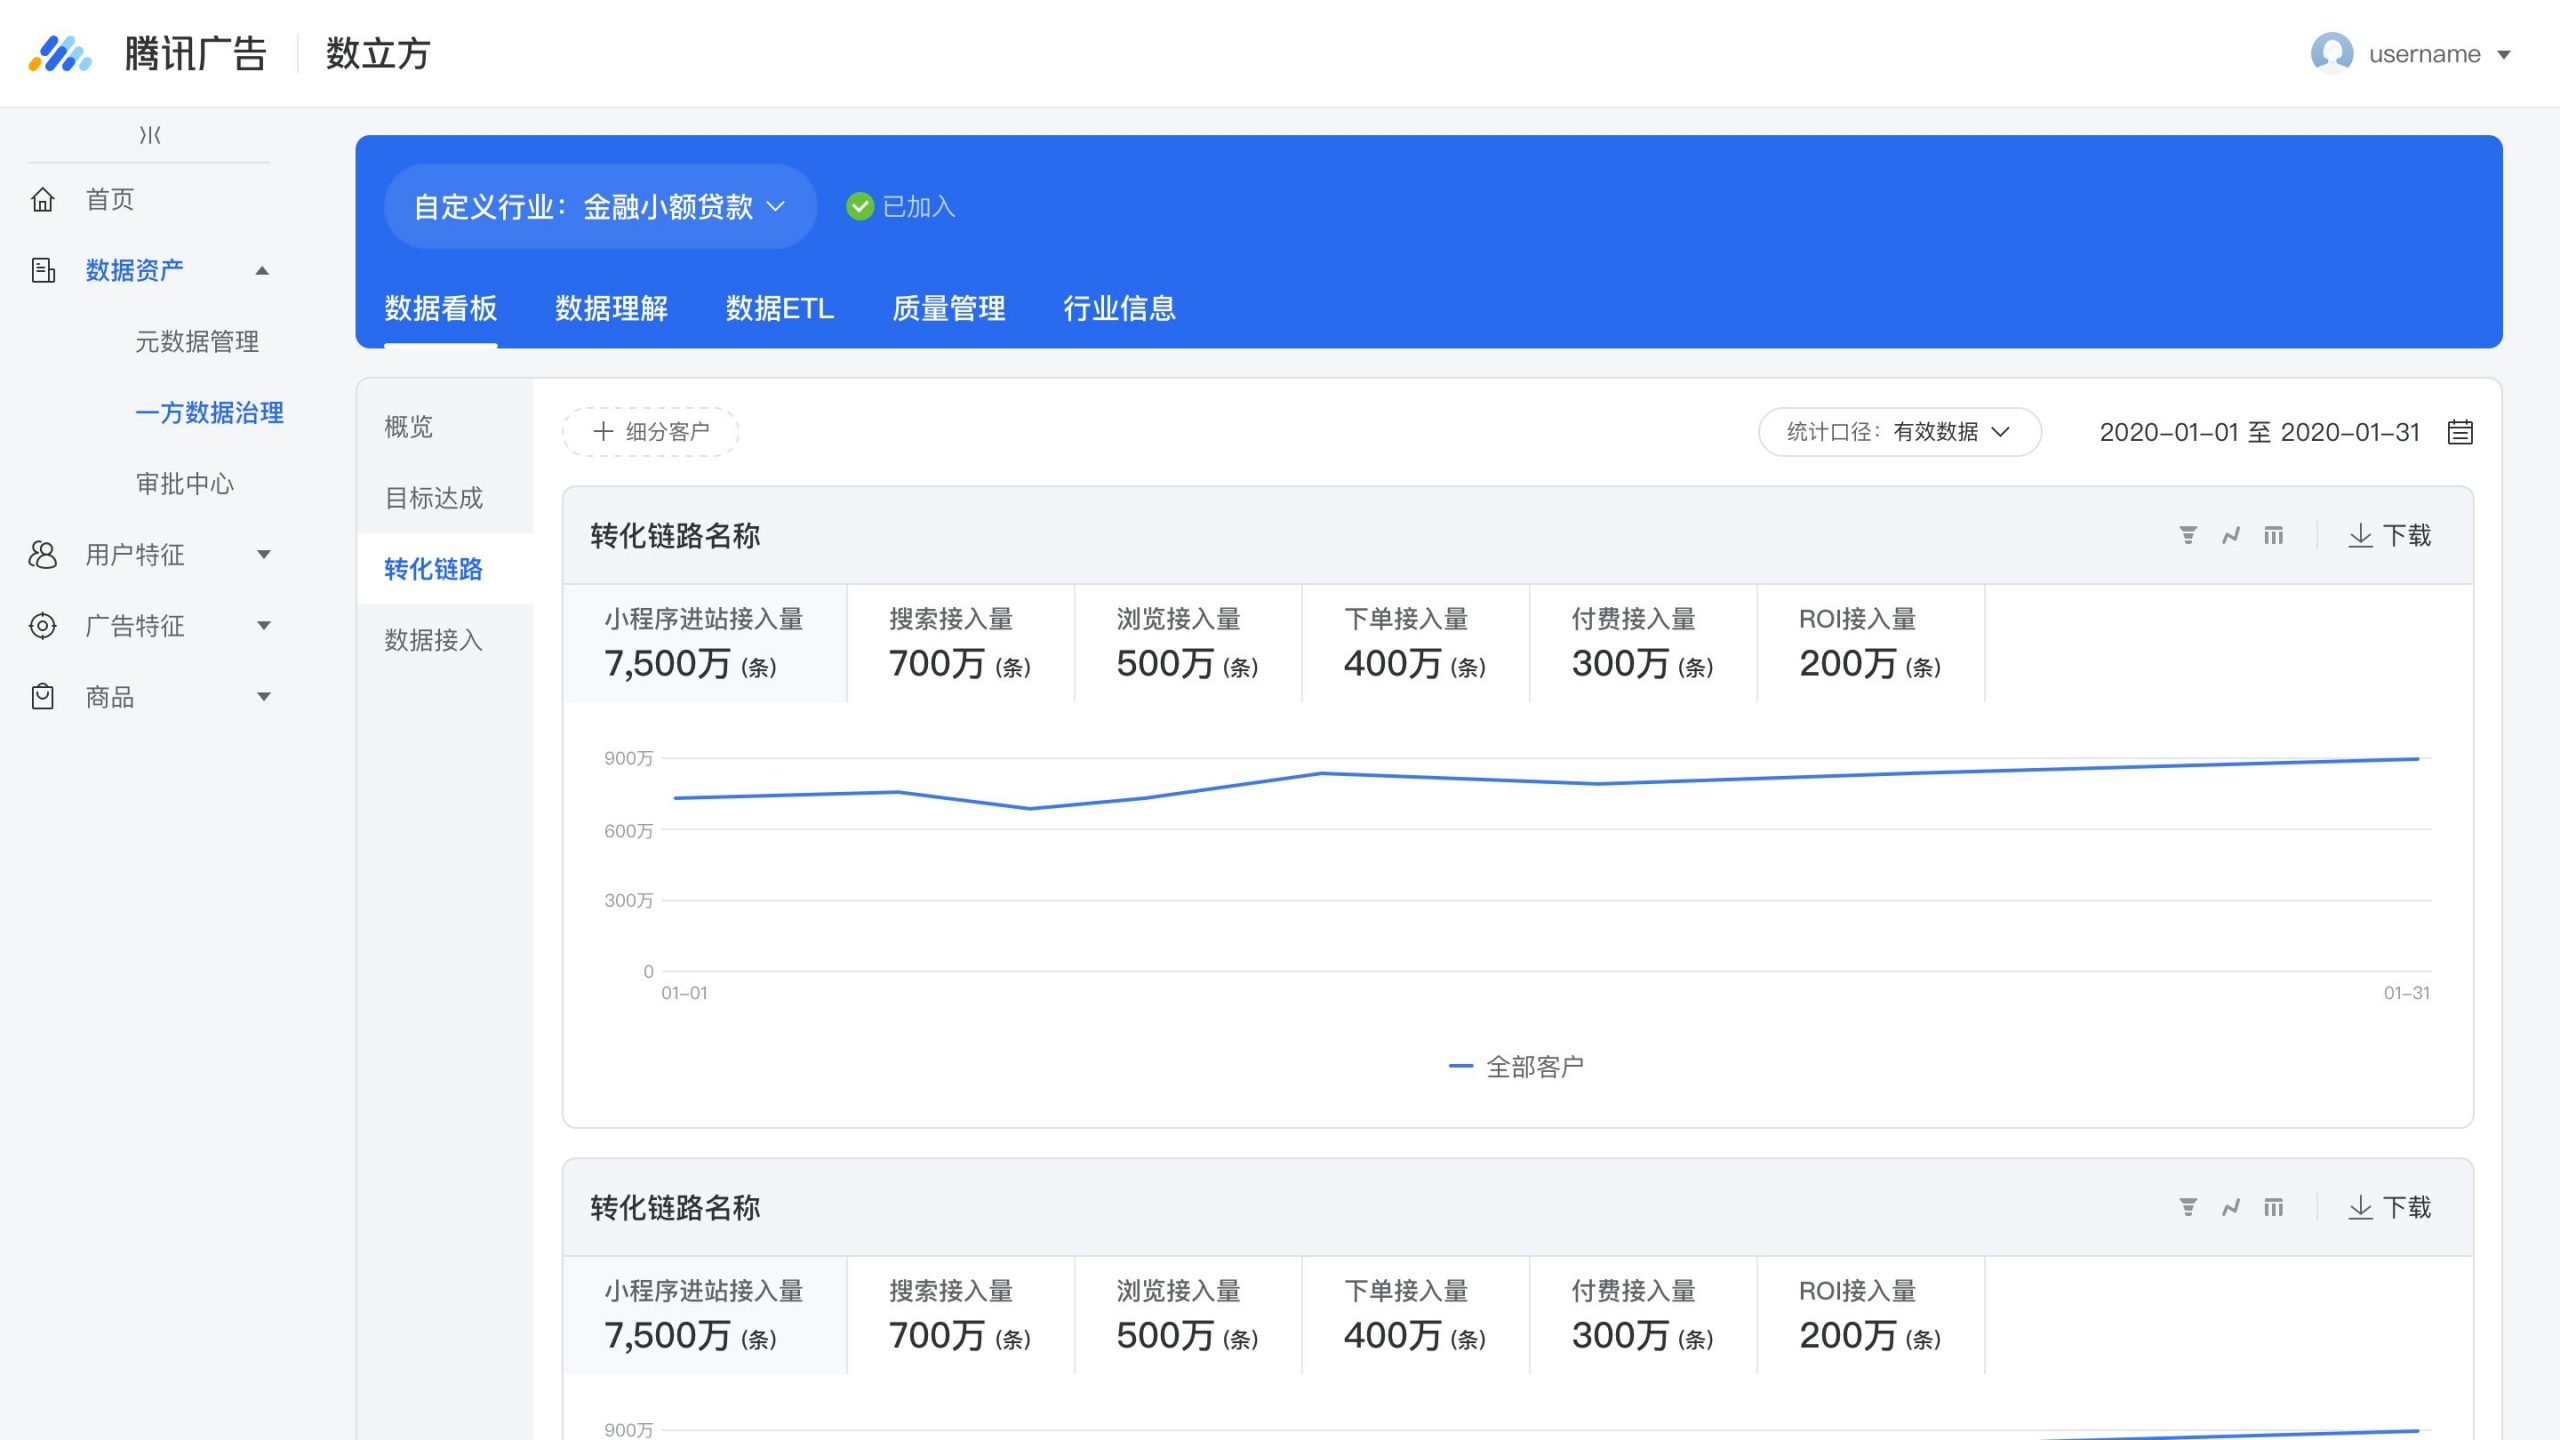
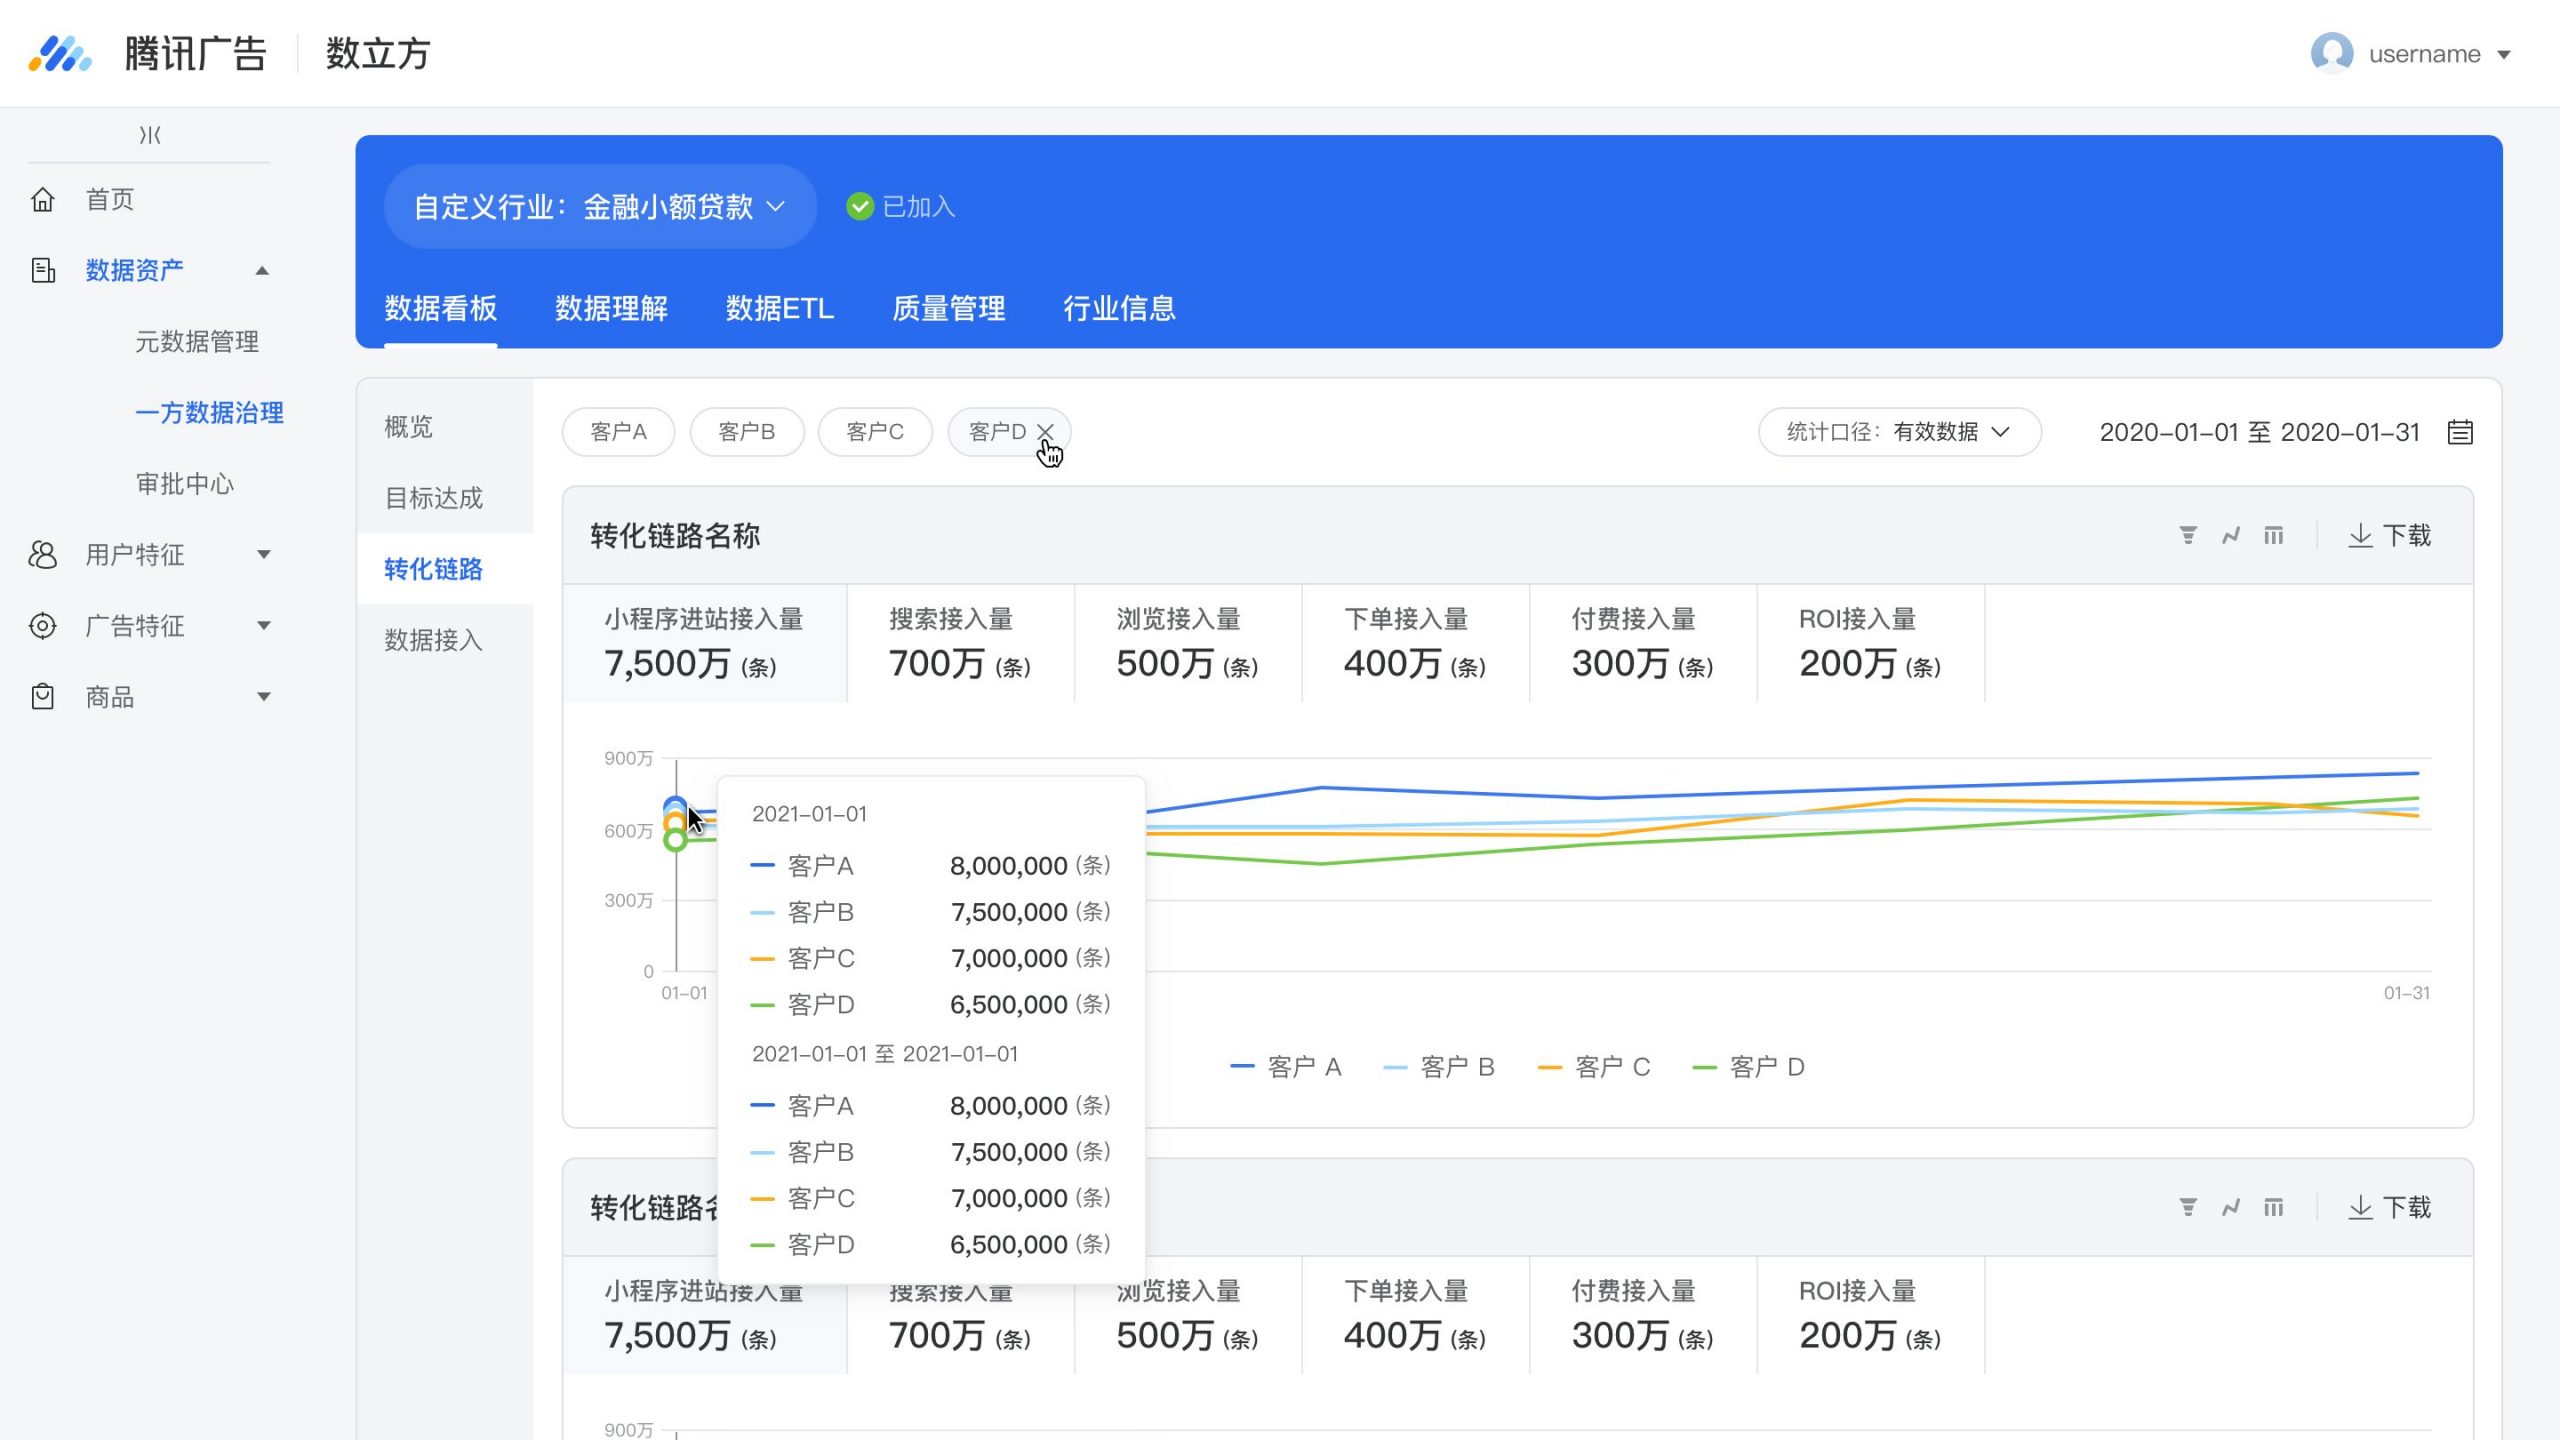
Conversion Path
Based on the analysis of actual data, we have concluded that funnel charts are not the best way to depict conversion paths. This is because, in certain industries, there may be an abundance of data on some Action Types, while others may have little or no data available. As a result, the funnel chart only represents the progression of Action Types, rather than the sequential progression of volume.
Data Ingestion
- Segmentation: Customers
Filters: Statistical Calibre, Time Granularity, Action Type, Action Parameter, Channel
Dimensions: behaviour, audience, attribute
Metrics: behavioural data ingestion volume and its quantity
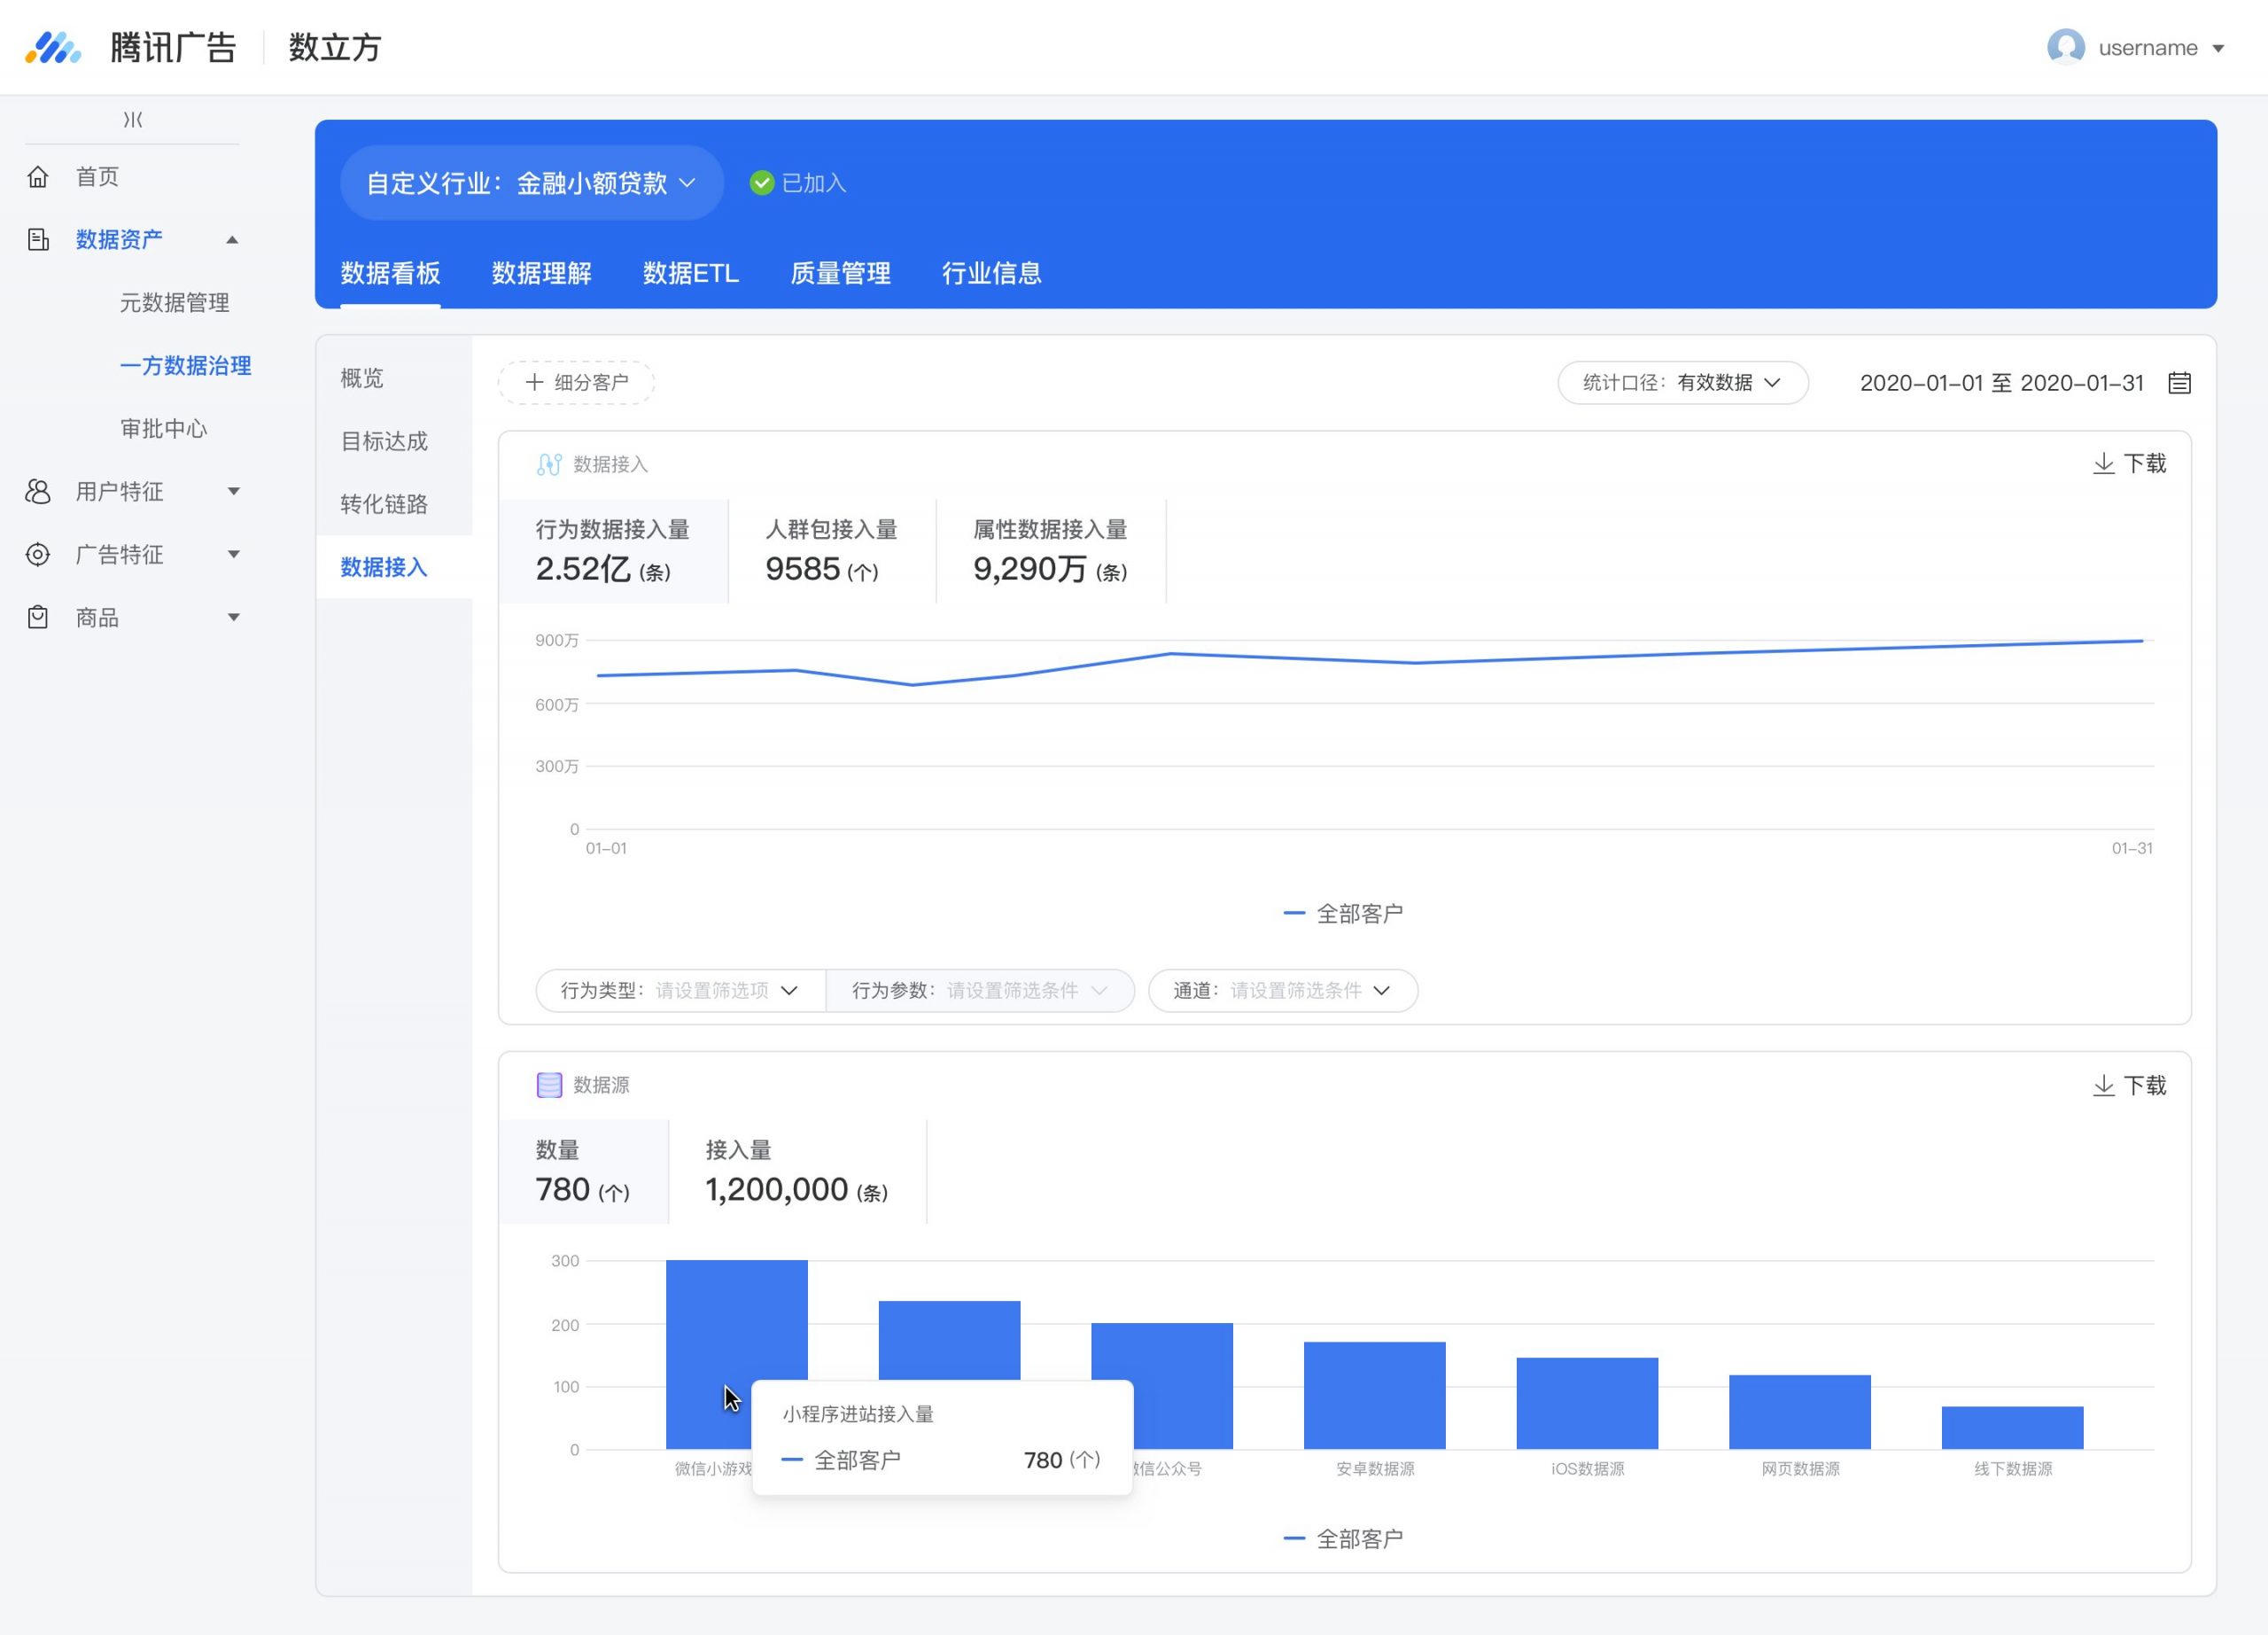
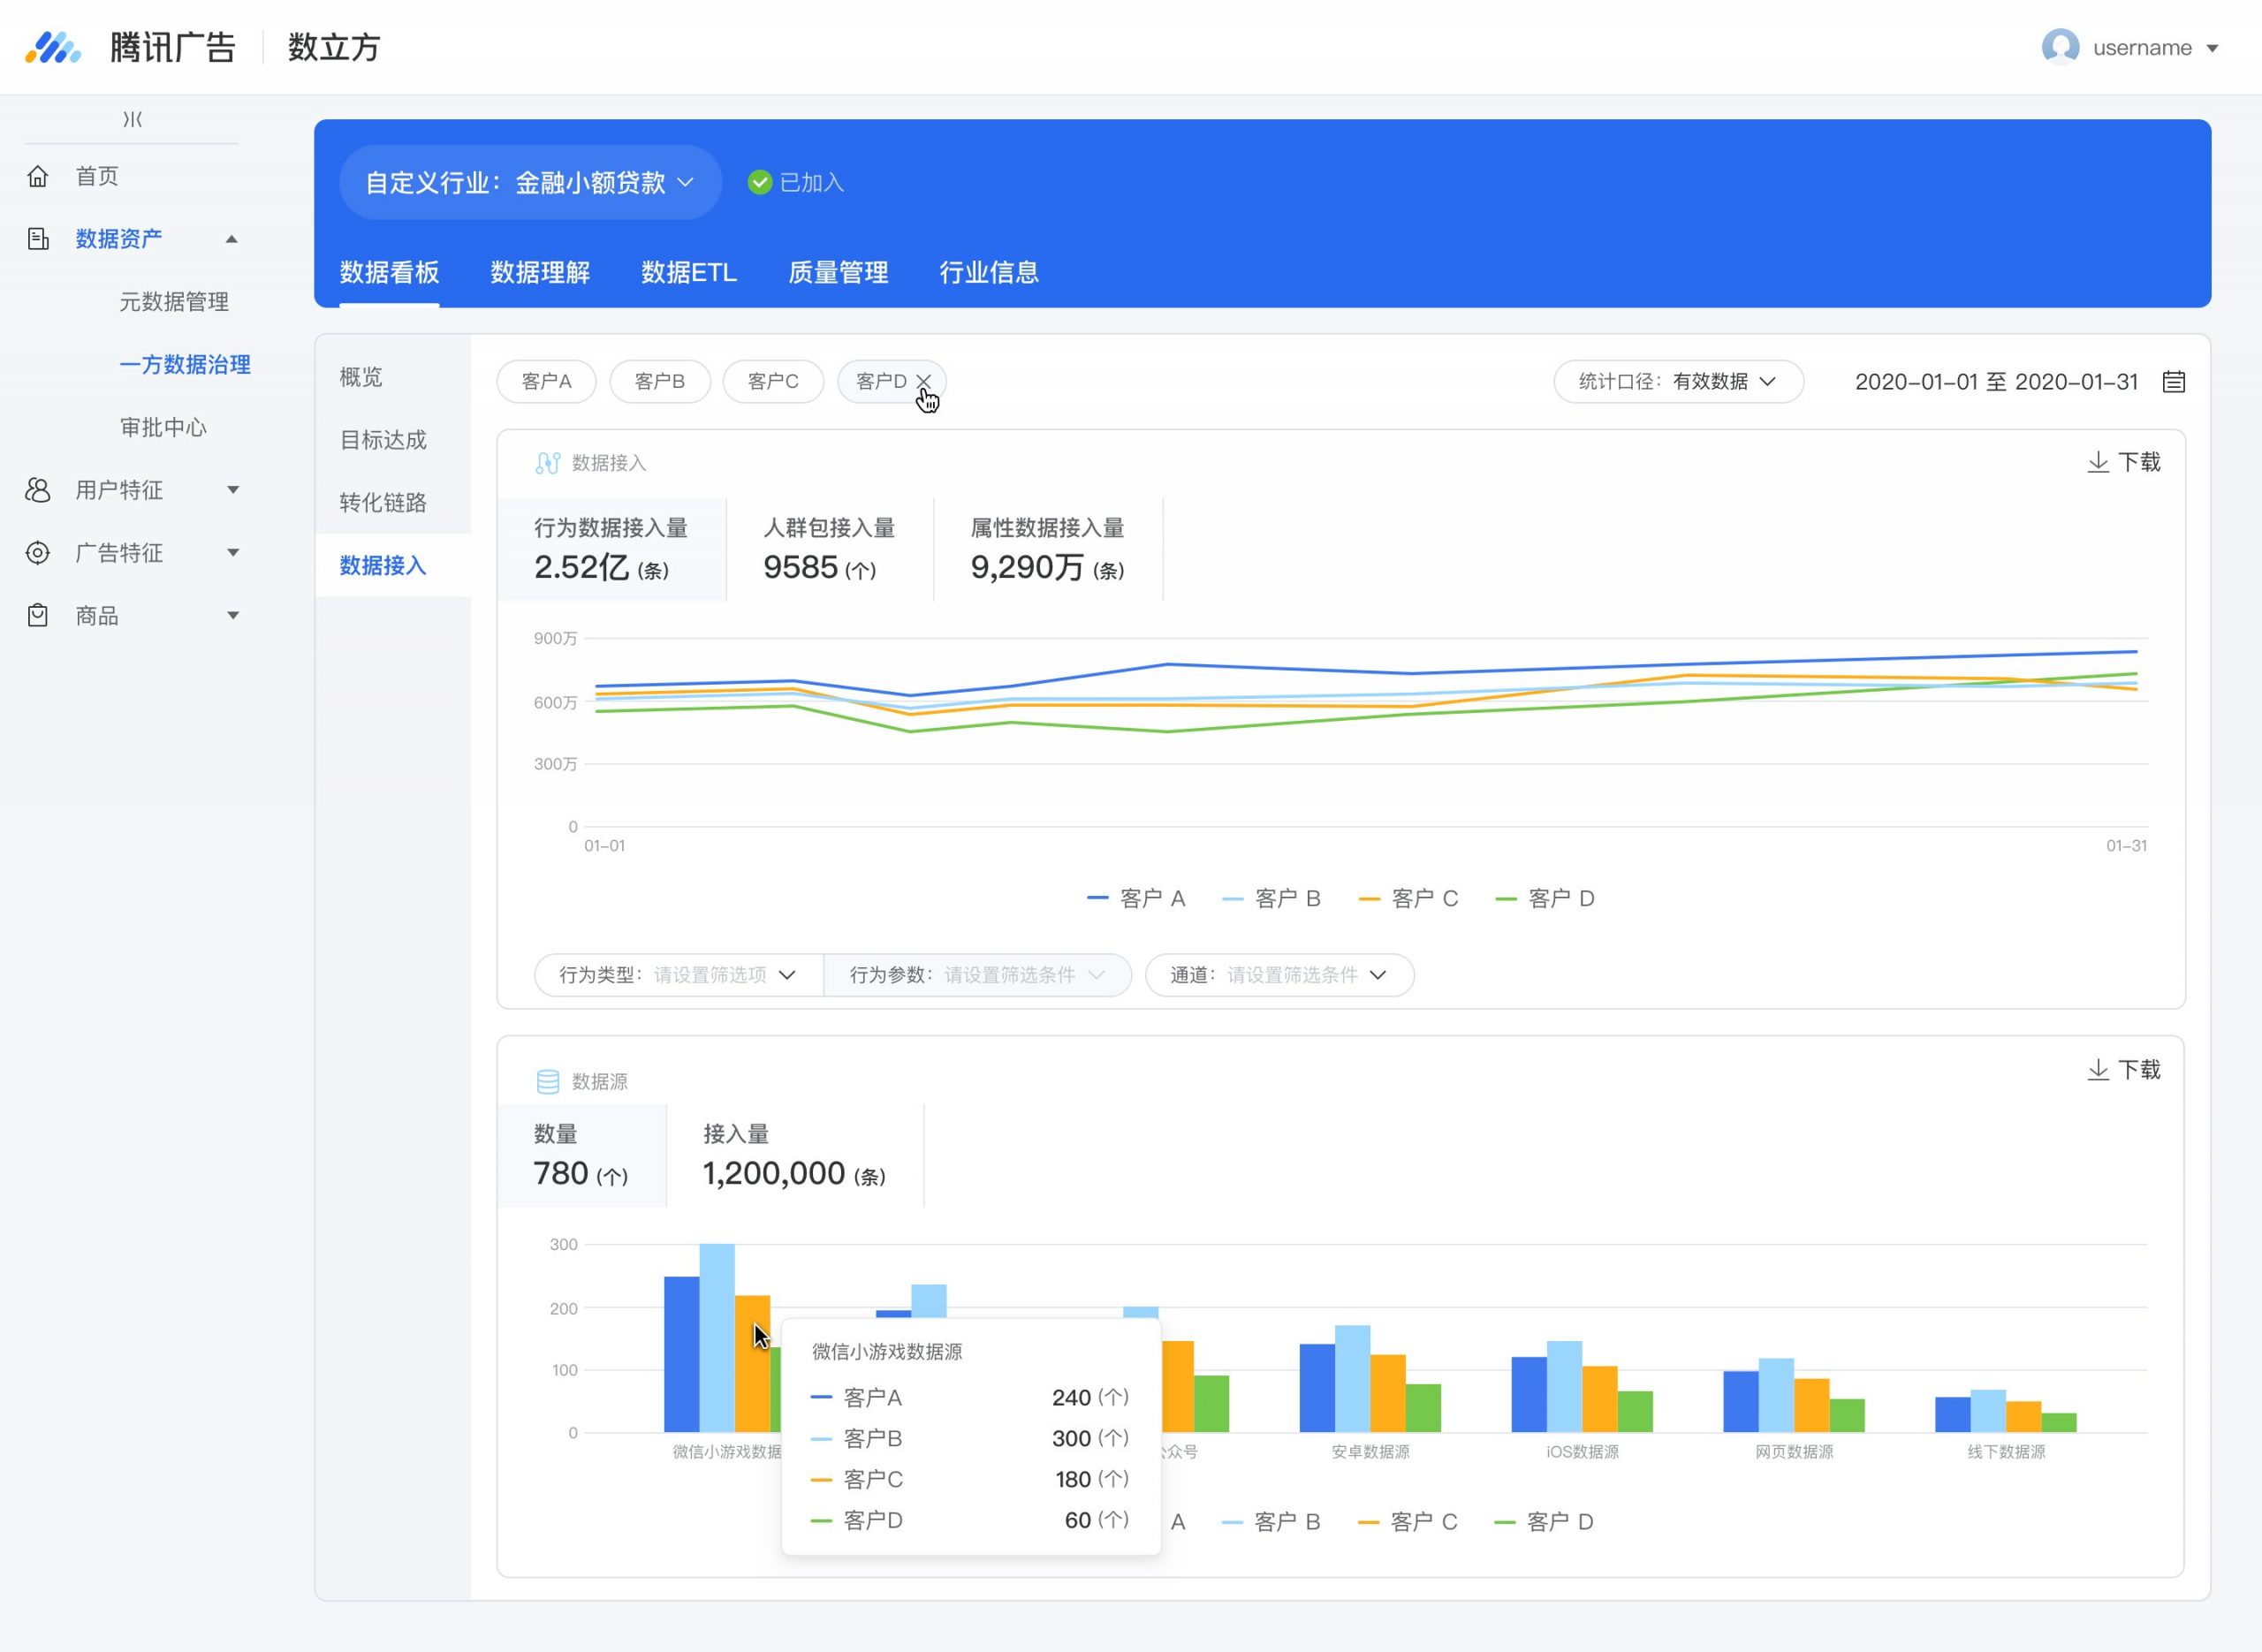
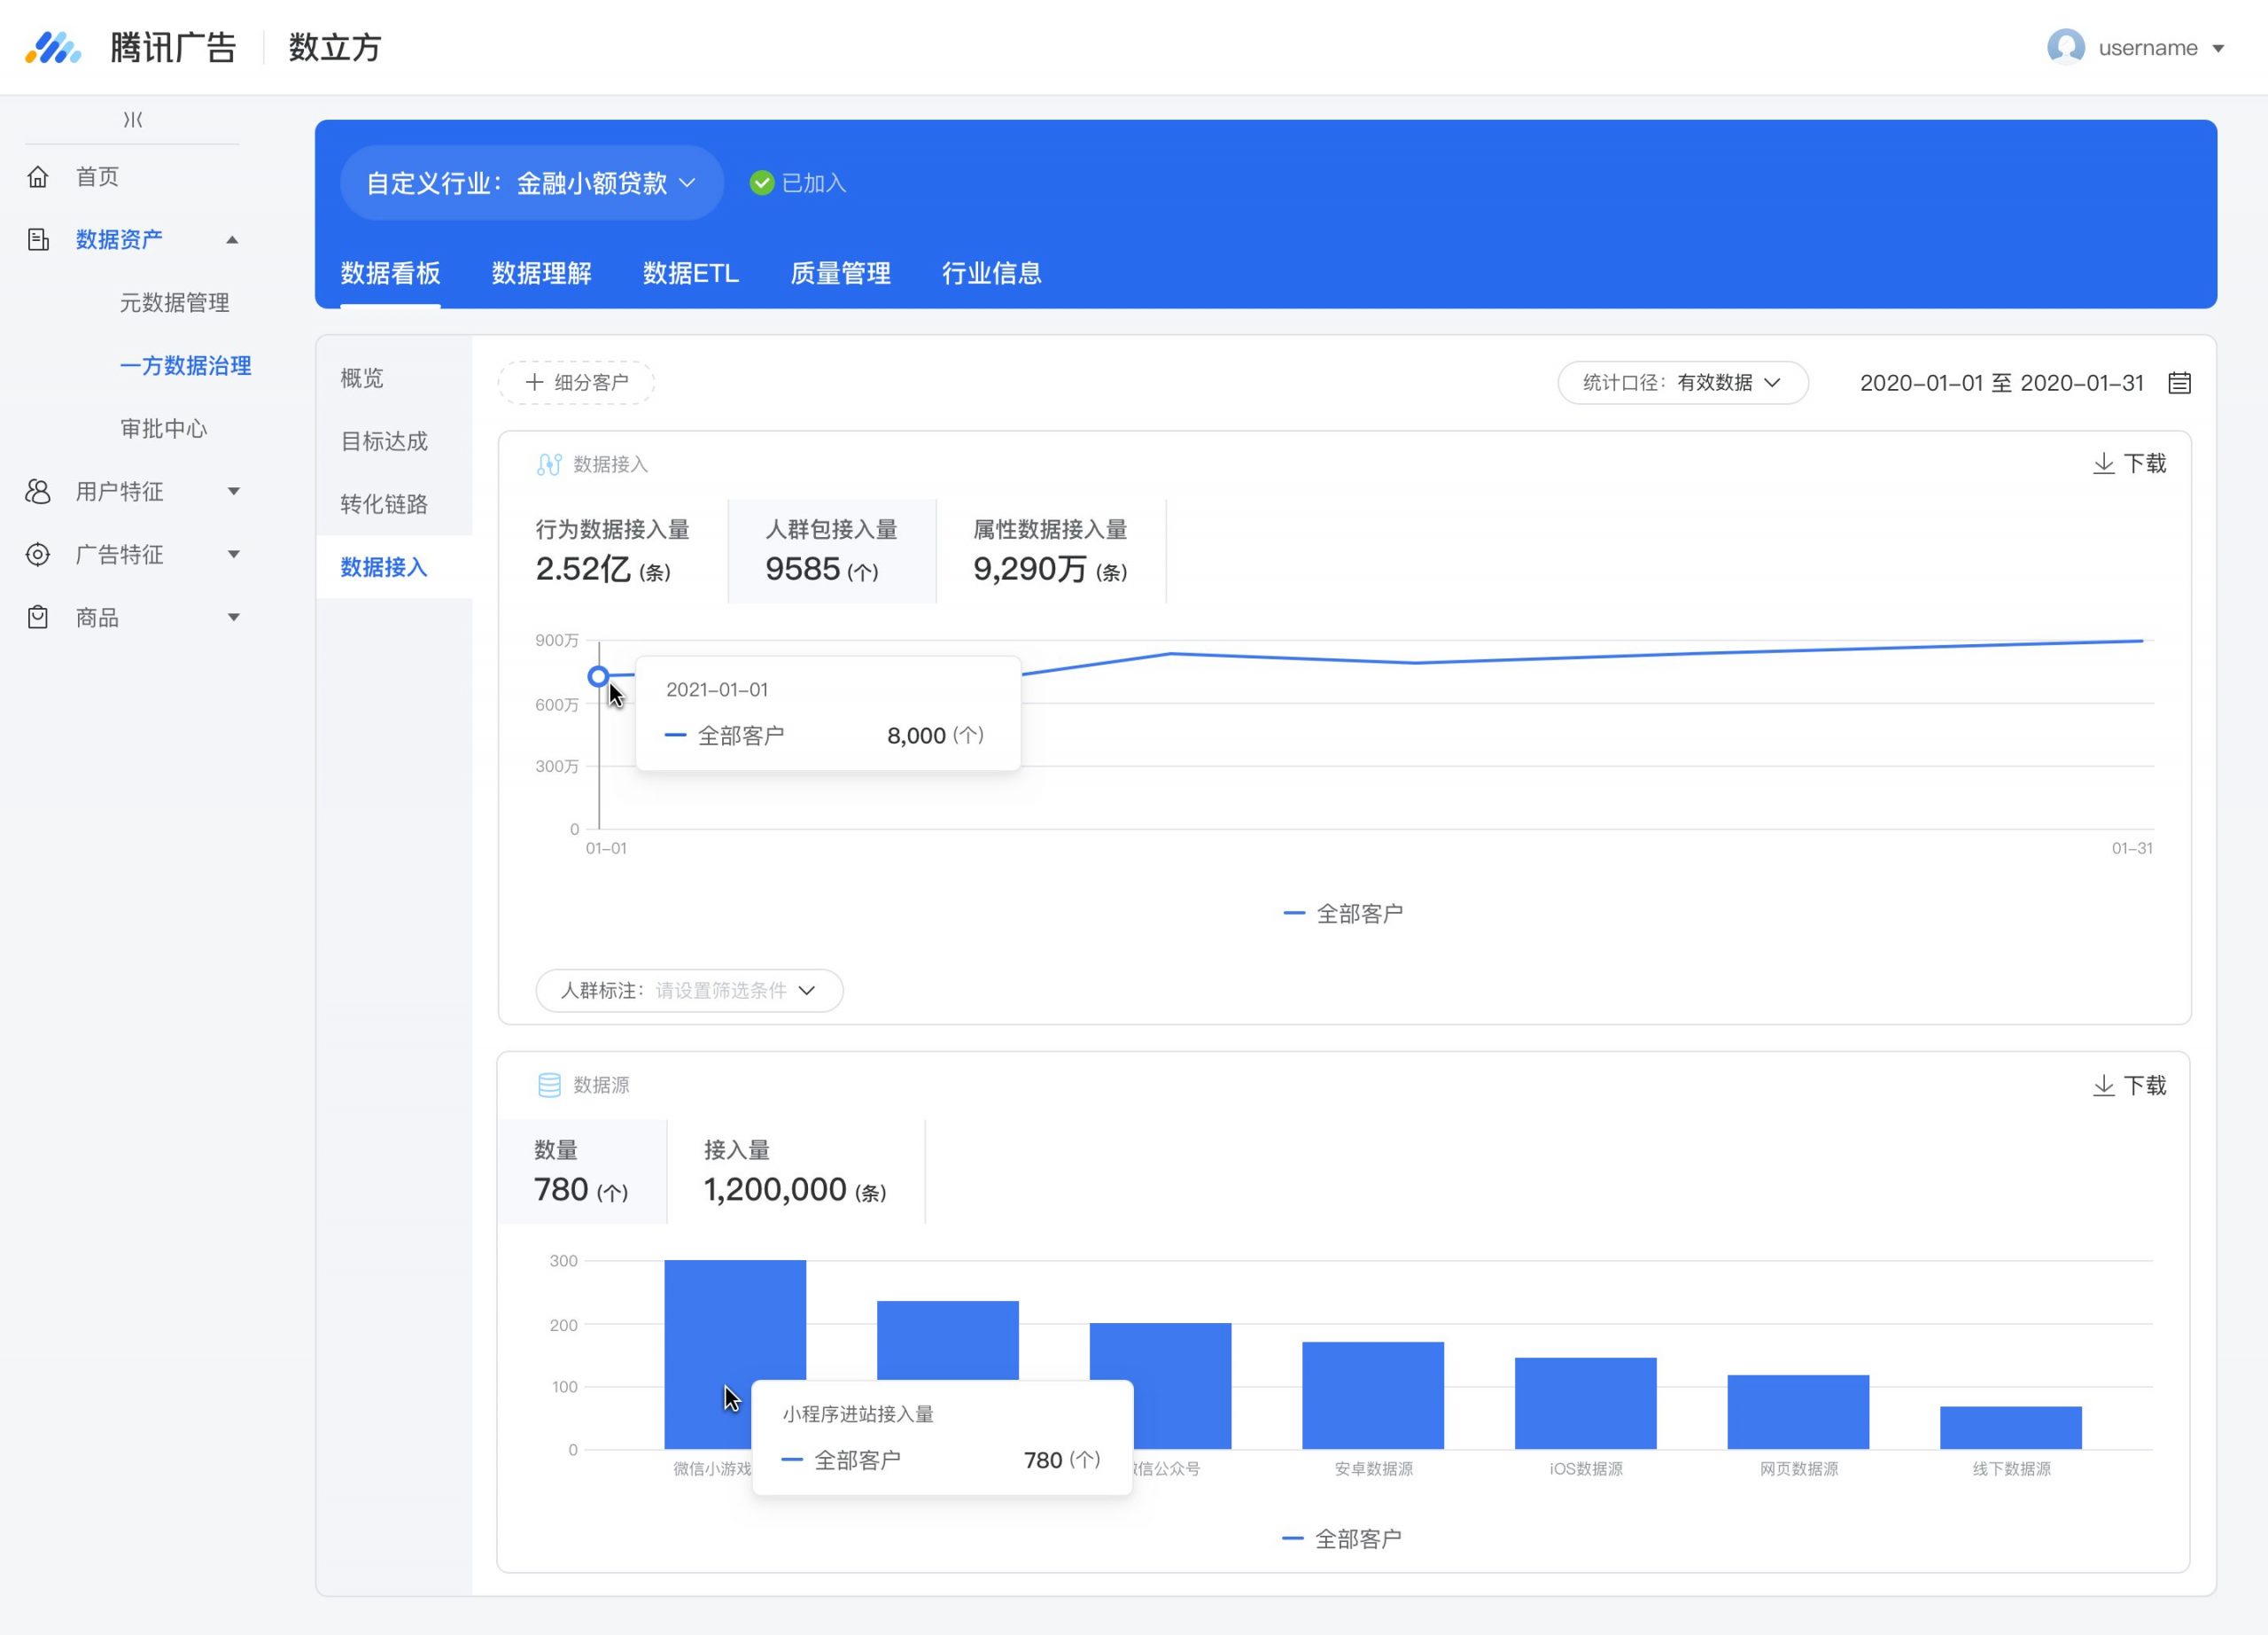
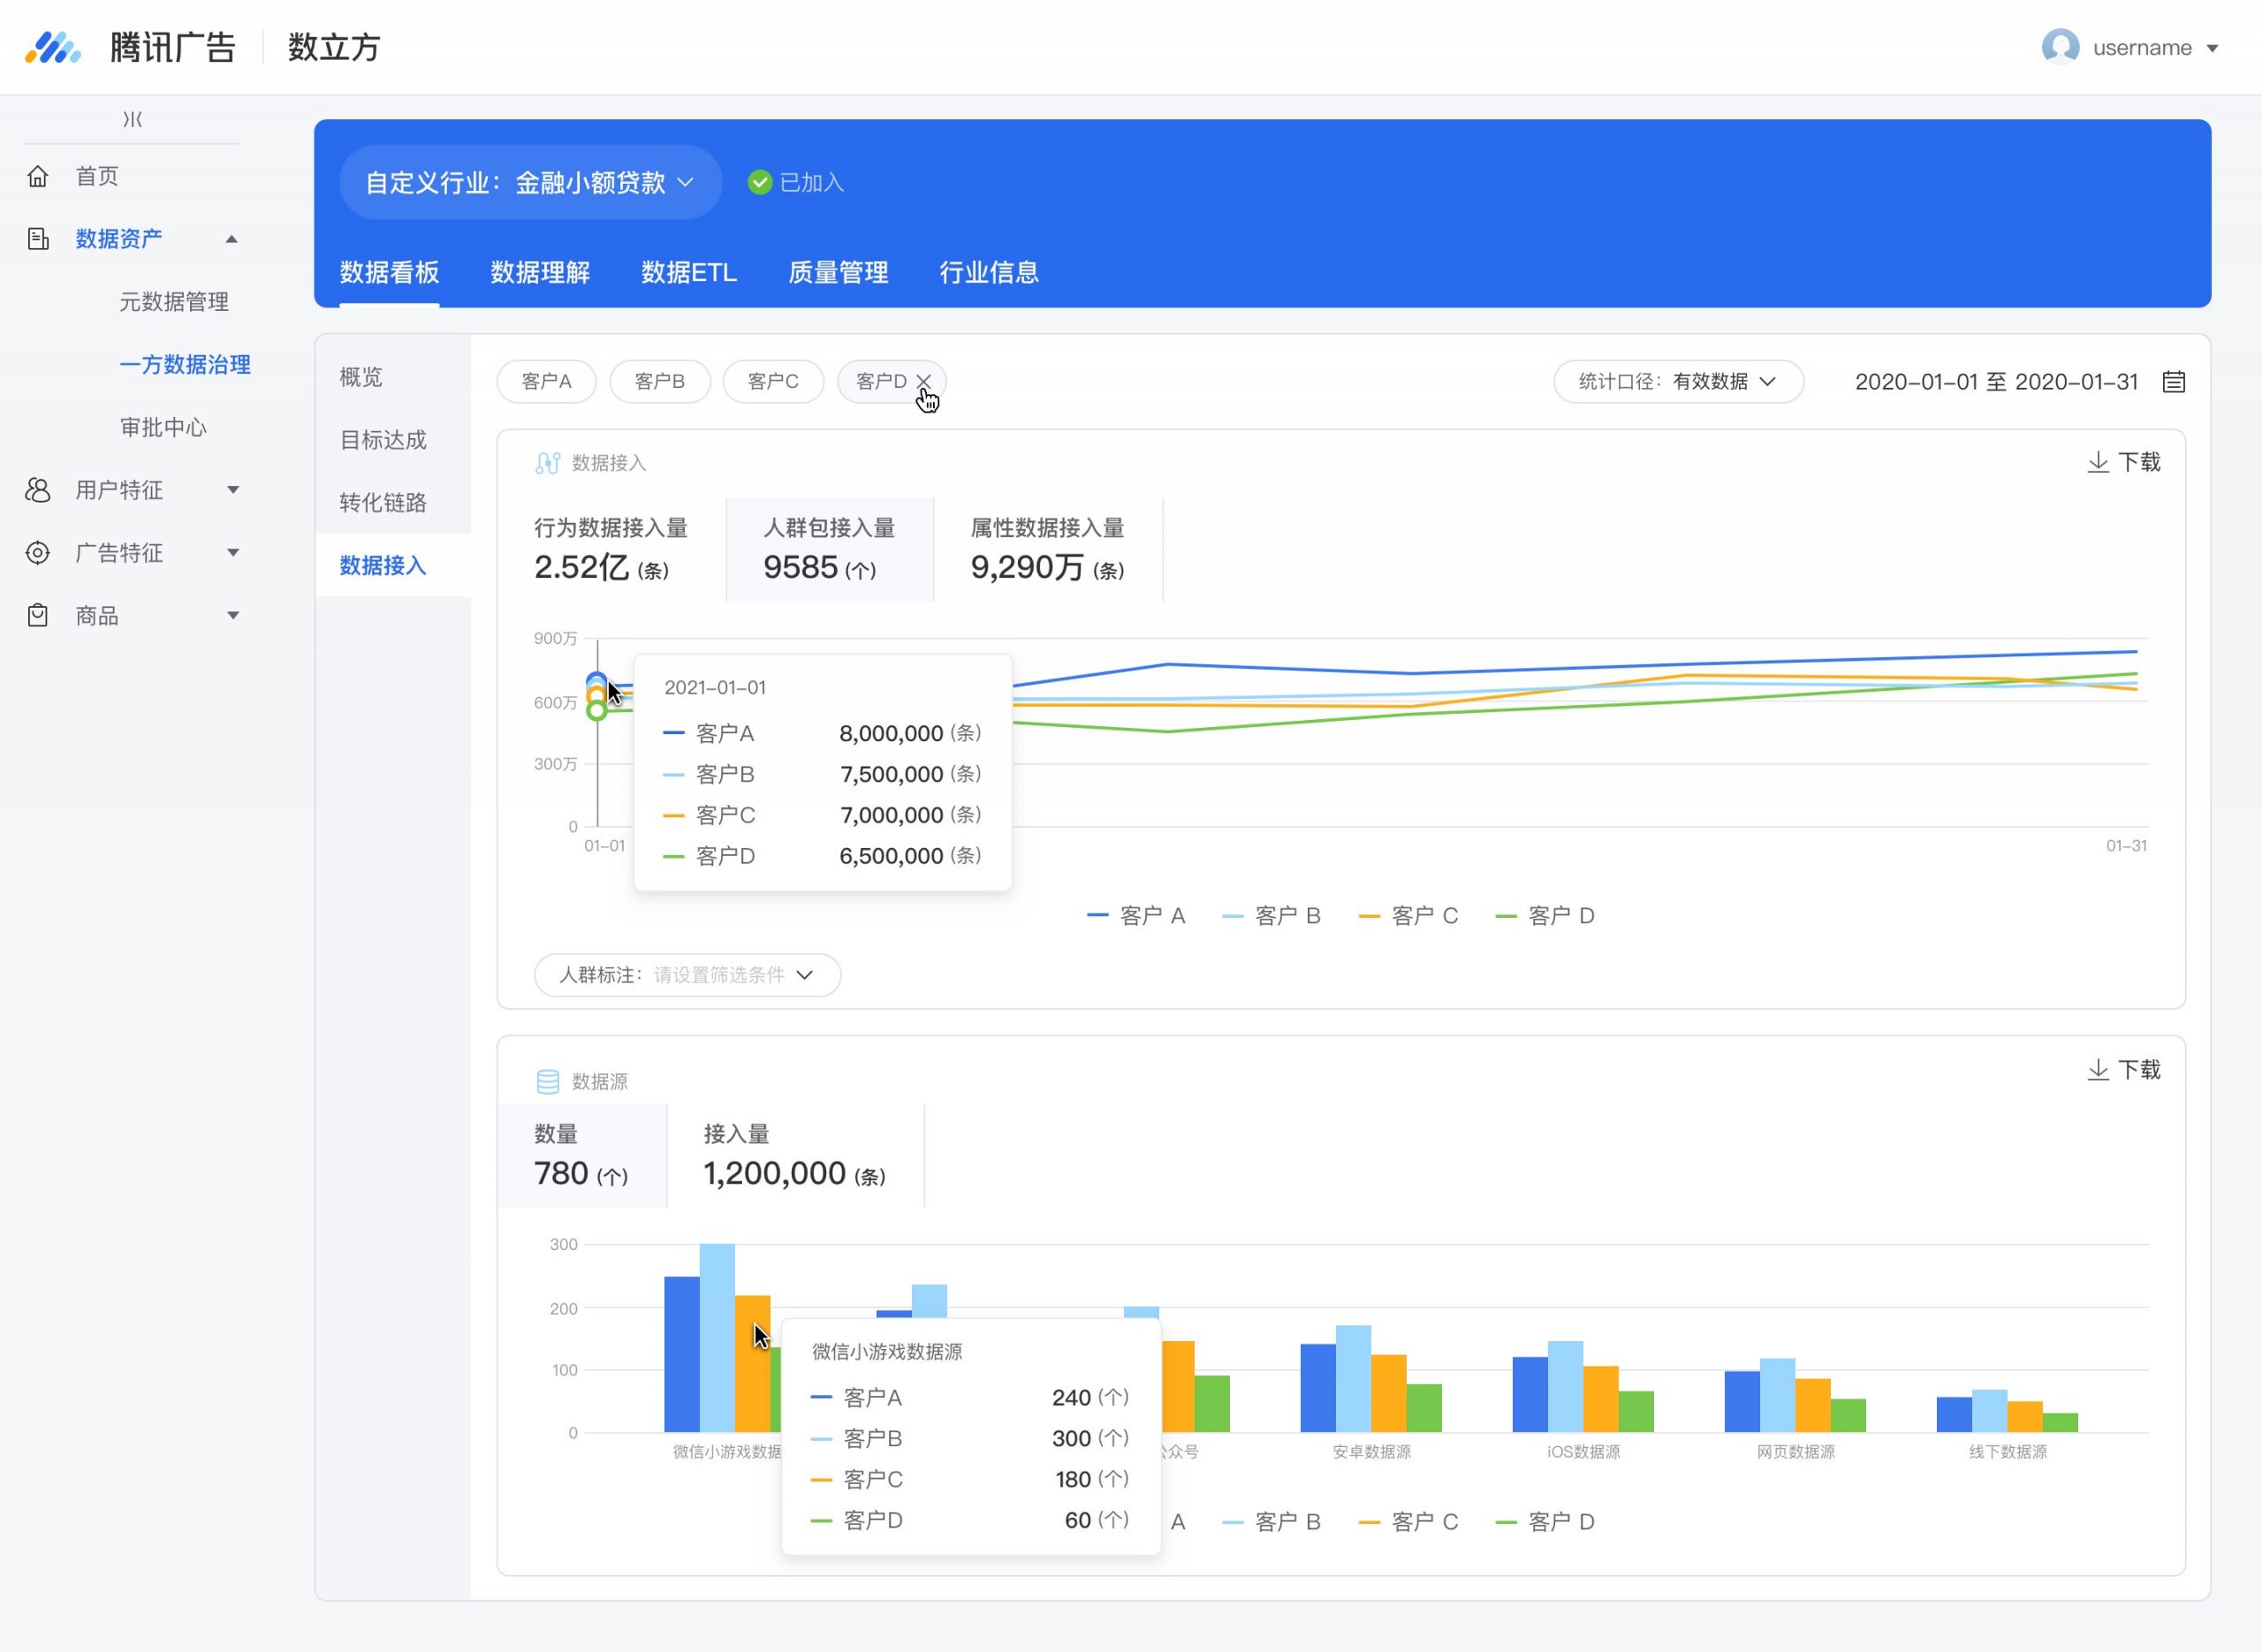
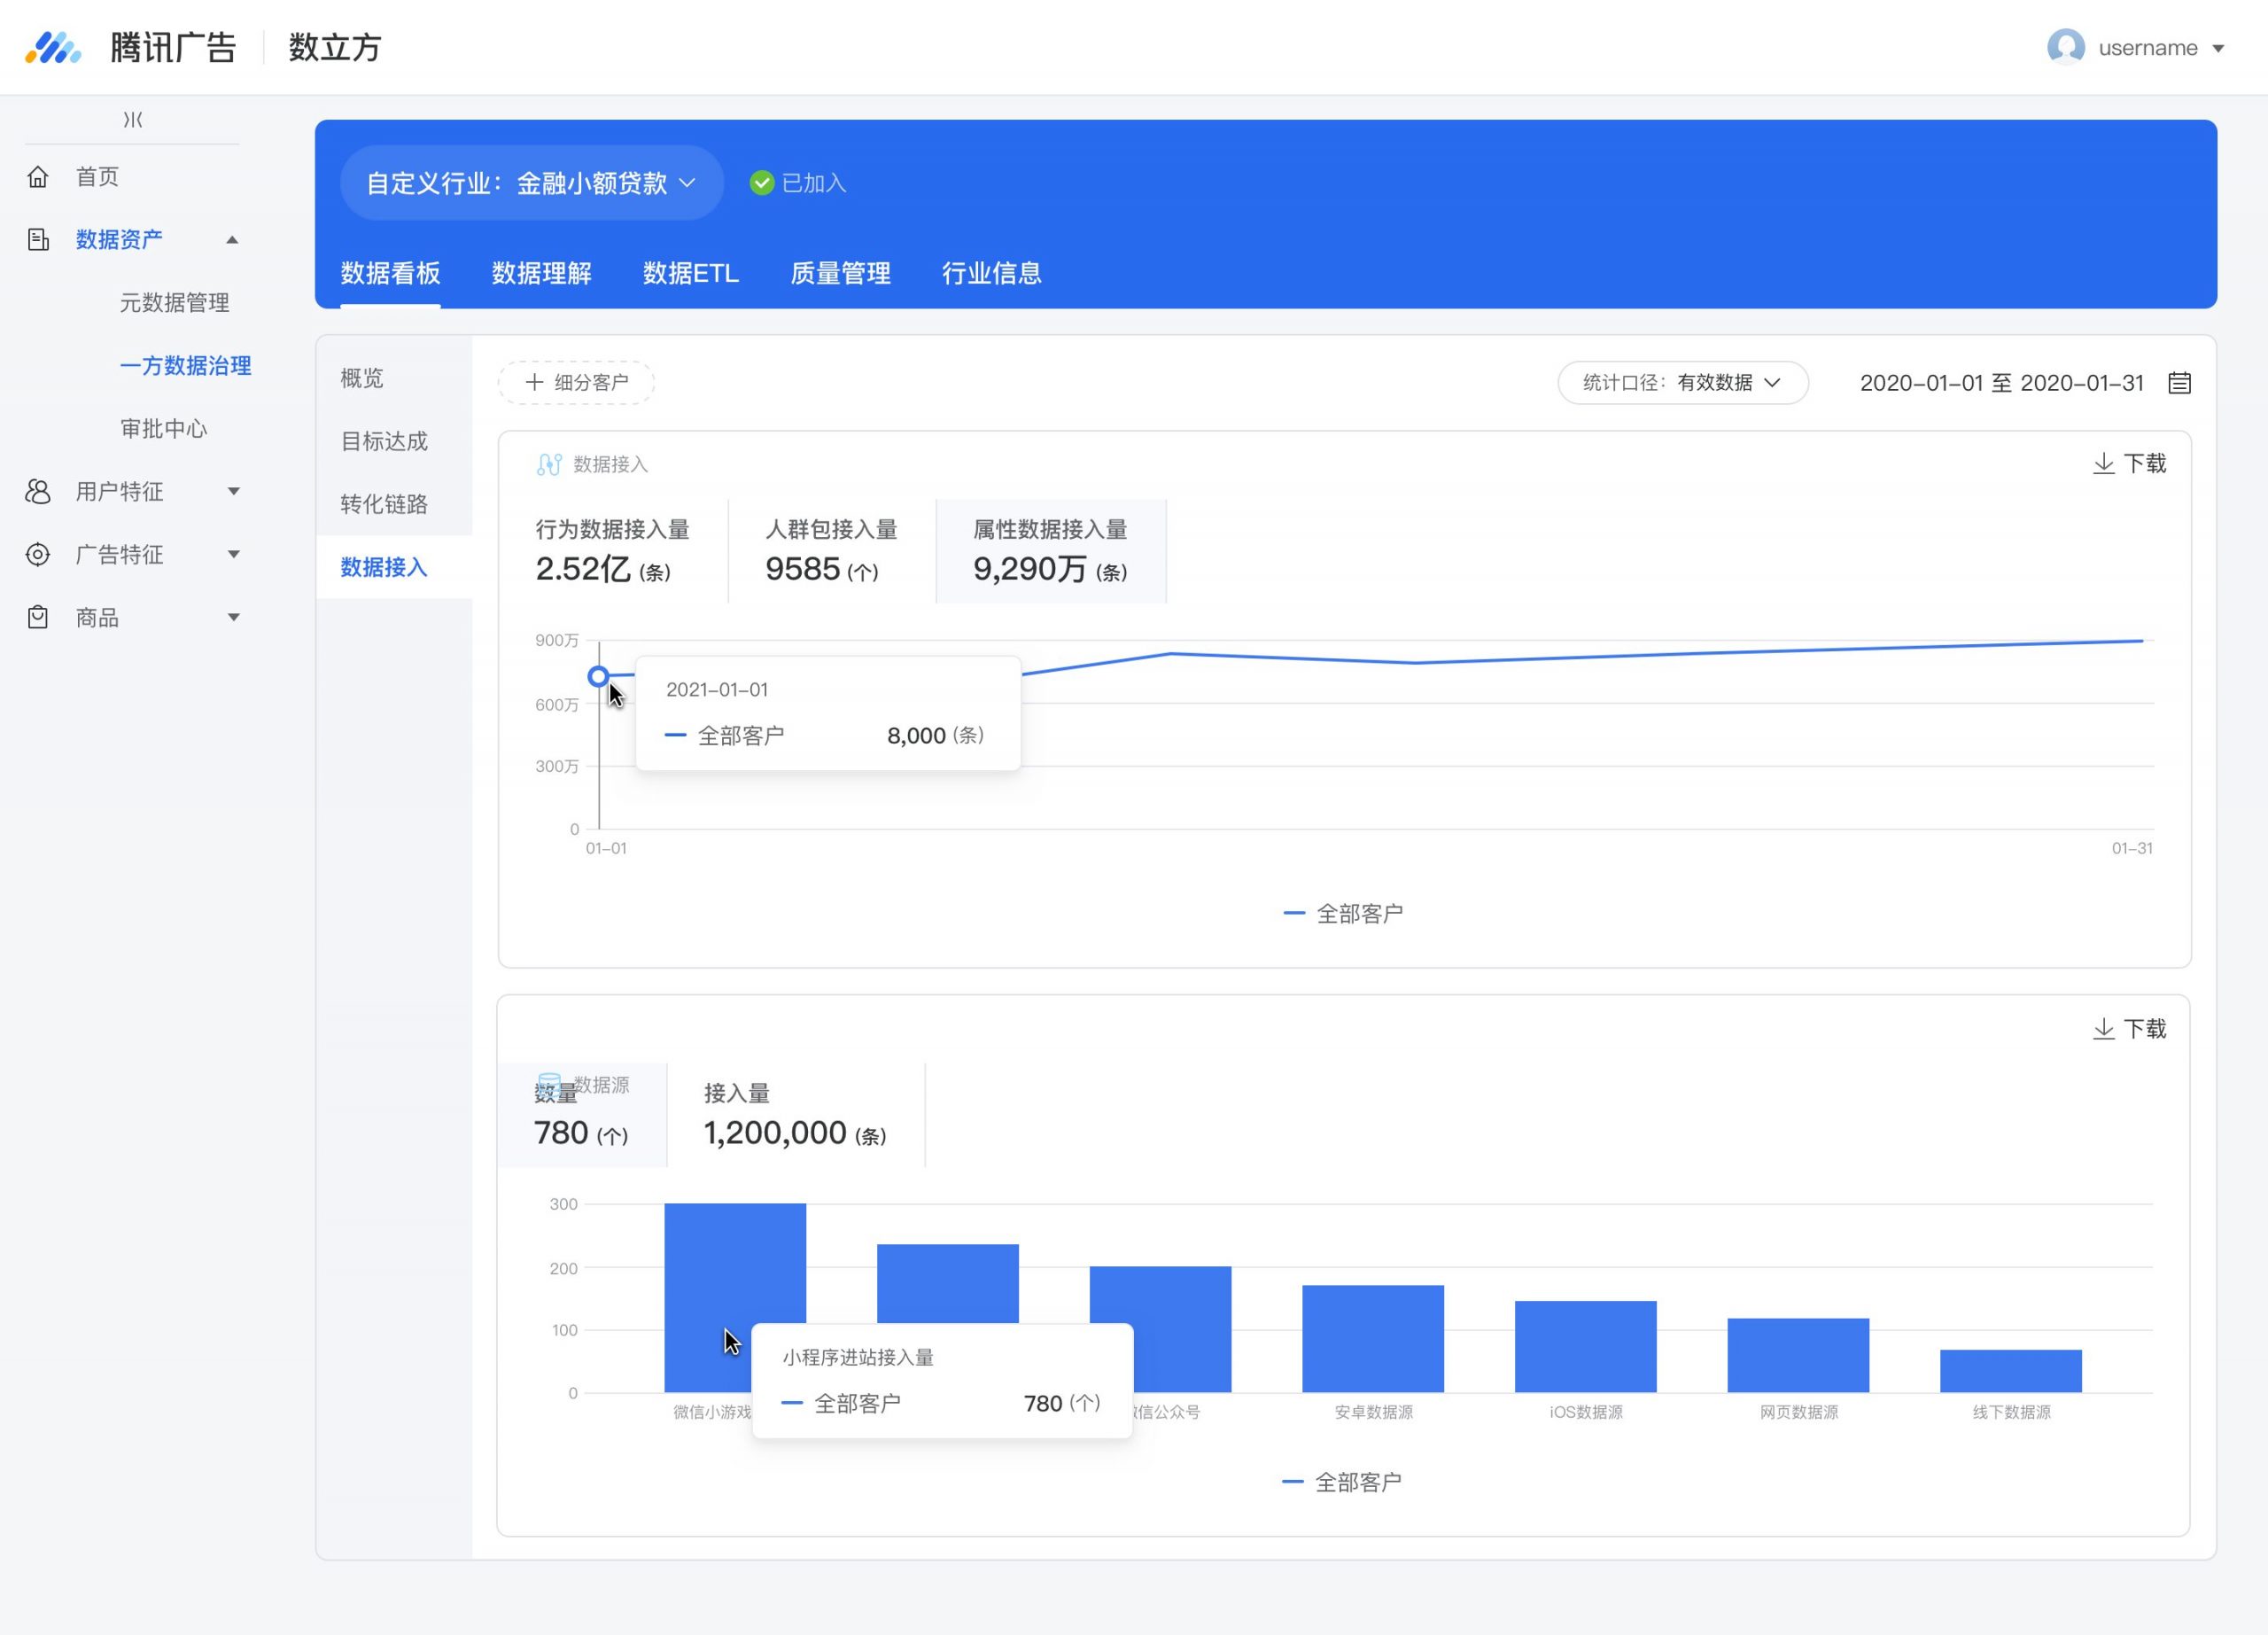
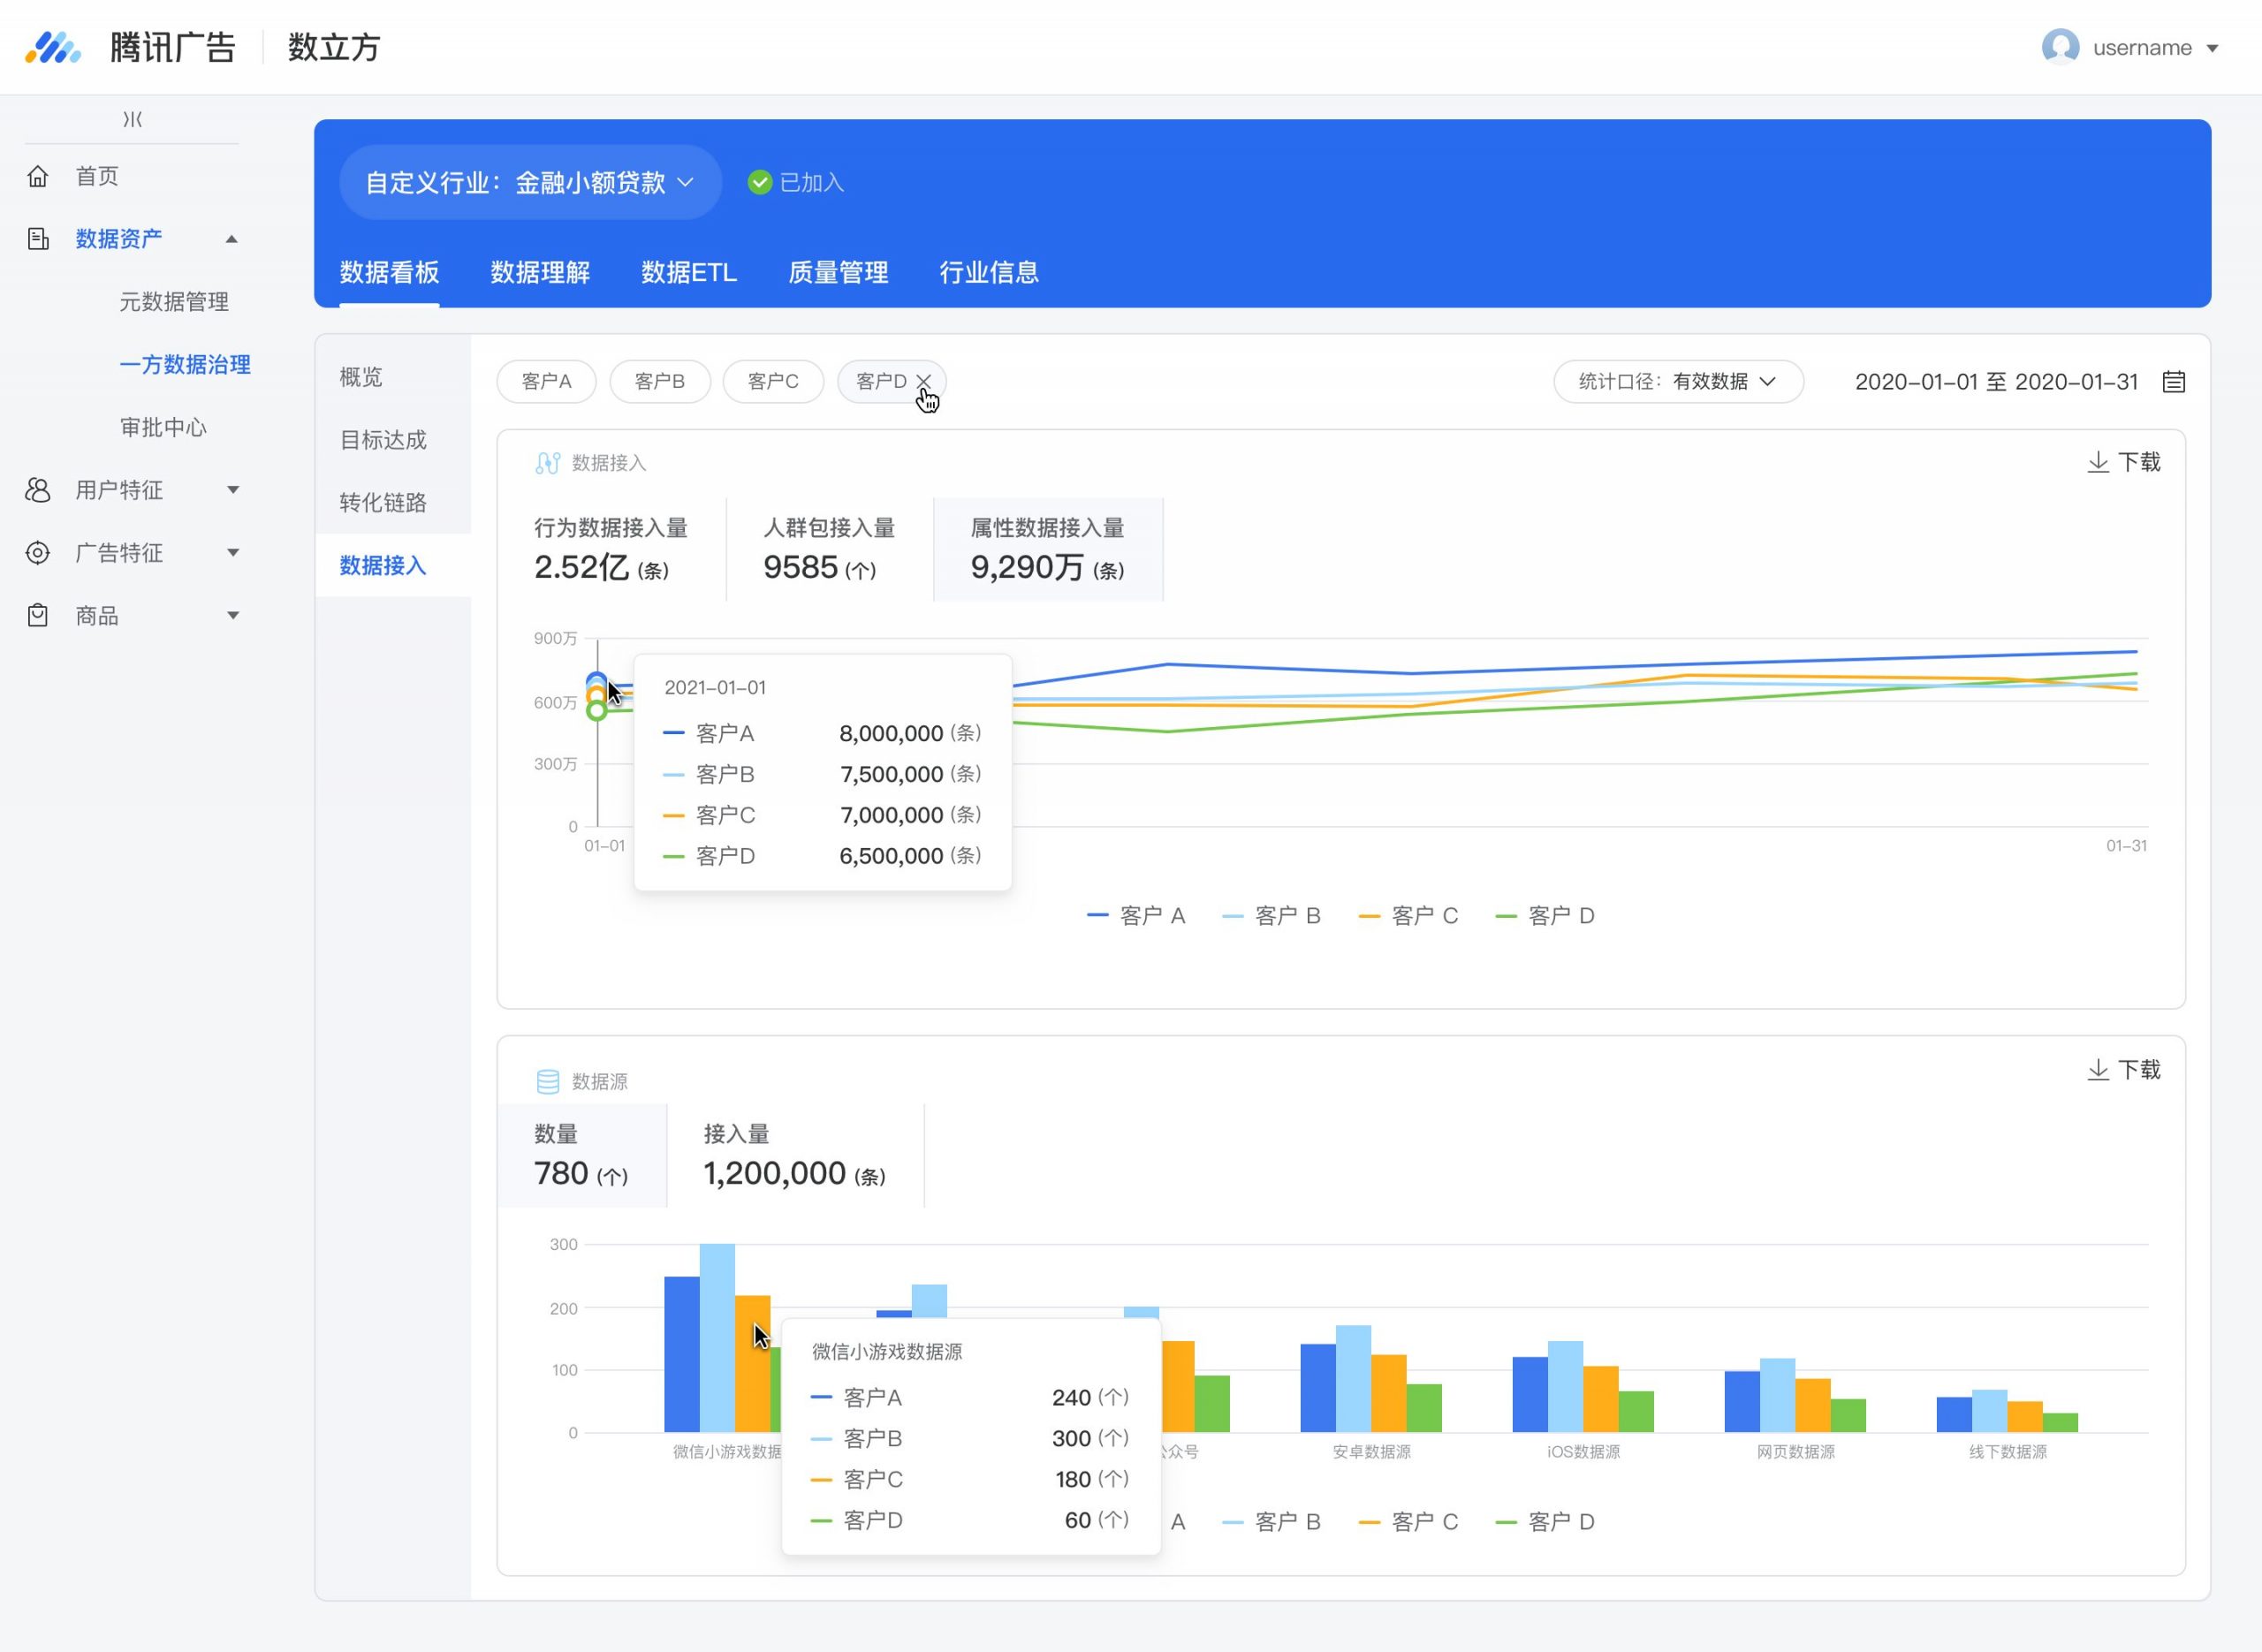
Data Ingestion
What I've learned
The process of productizing first-party data governance involves moving from zero to one. Even today, there is still a lot of room for improvement to increase the efficiency and effectiveness of R&D. When looking back at the whole process, it becomes evident that information technology has been a constant theme. Although data products are already highly informative, a deep understanding of the industry is necessary to identify the missing piece of information technology that is behind these products. Achieving this depth of understanding requires a step-by-step process.
© 2024 Xiang PENG. All Rights Reserved.